Changelog

Follow new updates and improvements to Growably.

Lead Source Report - Drill into Your Leads and See Value by Status

๐Ÿ‘€

What's New?

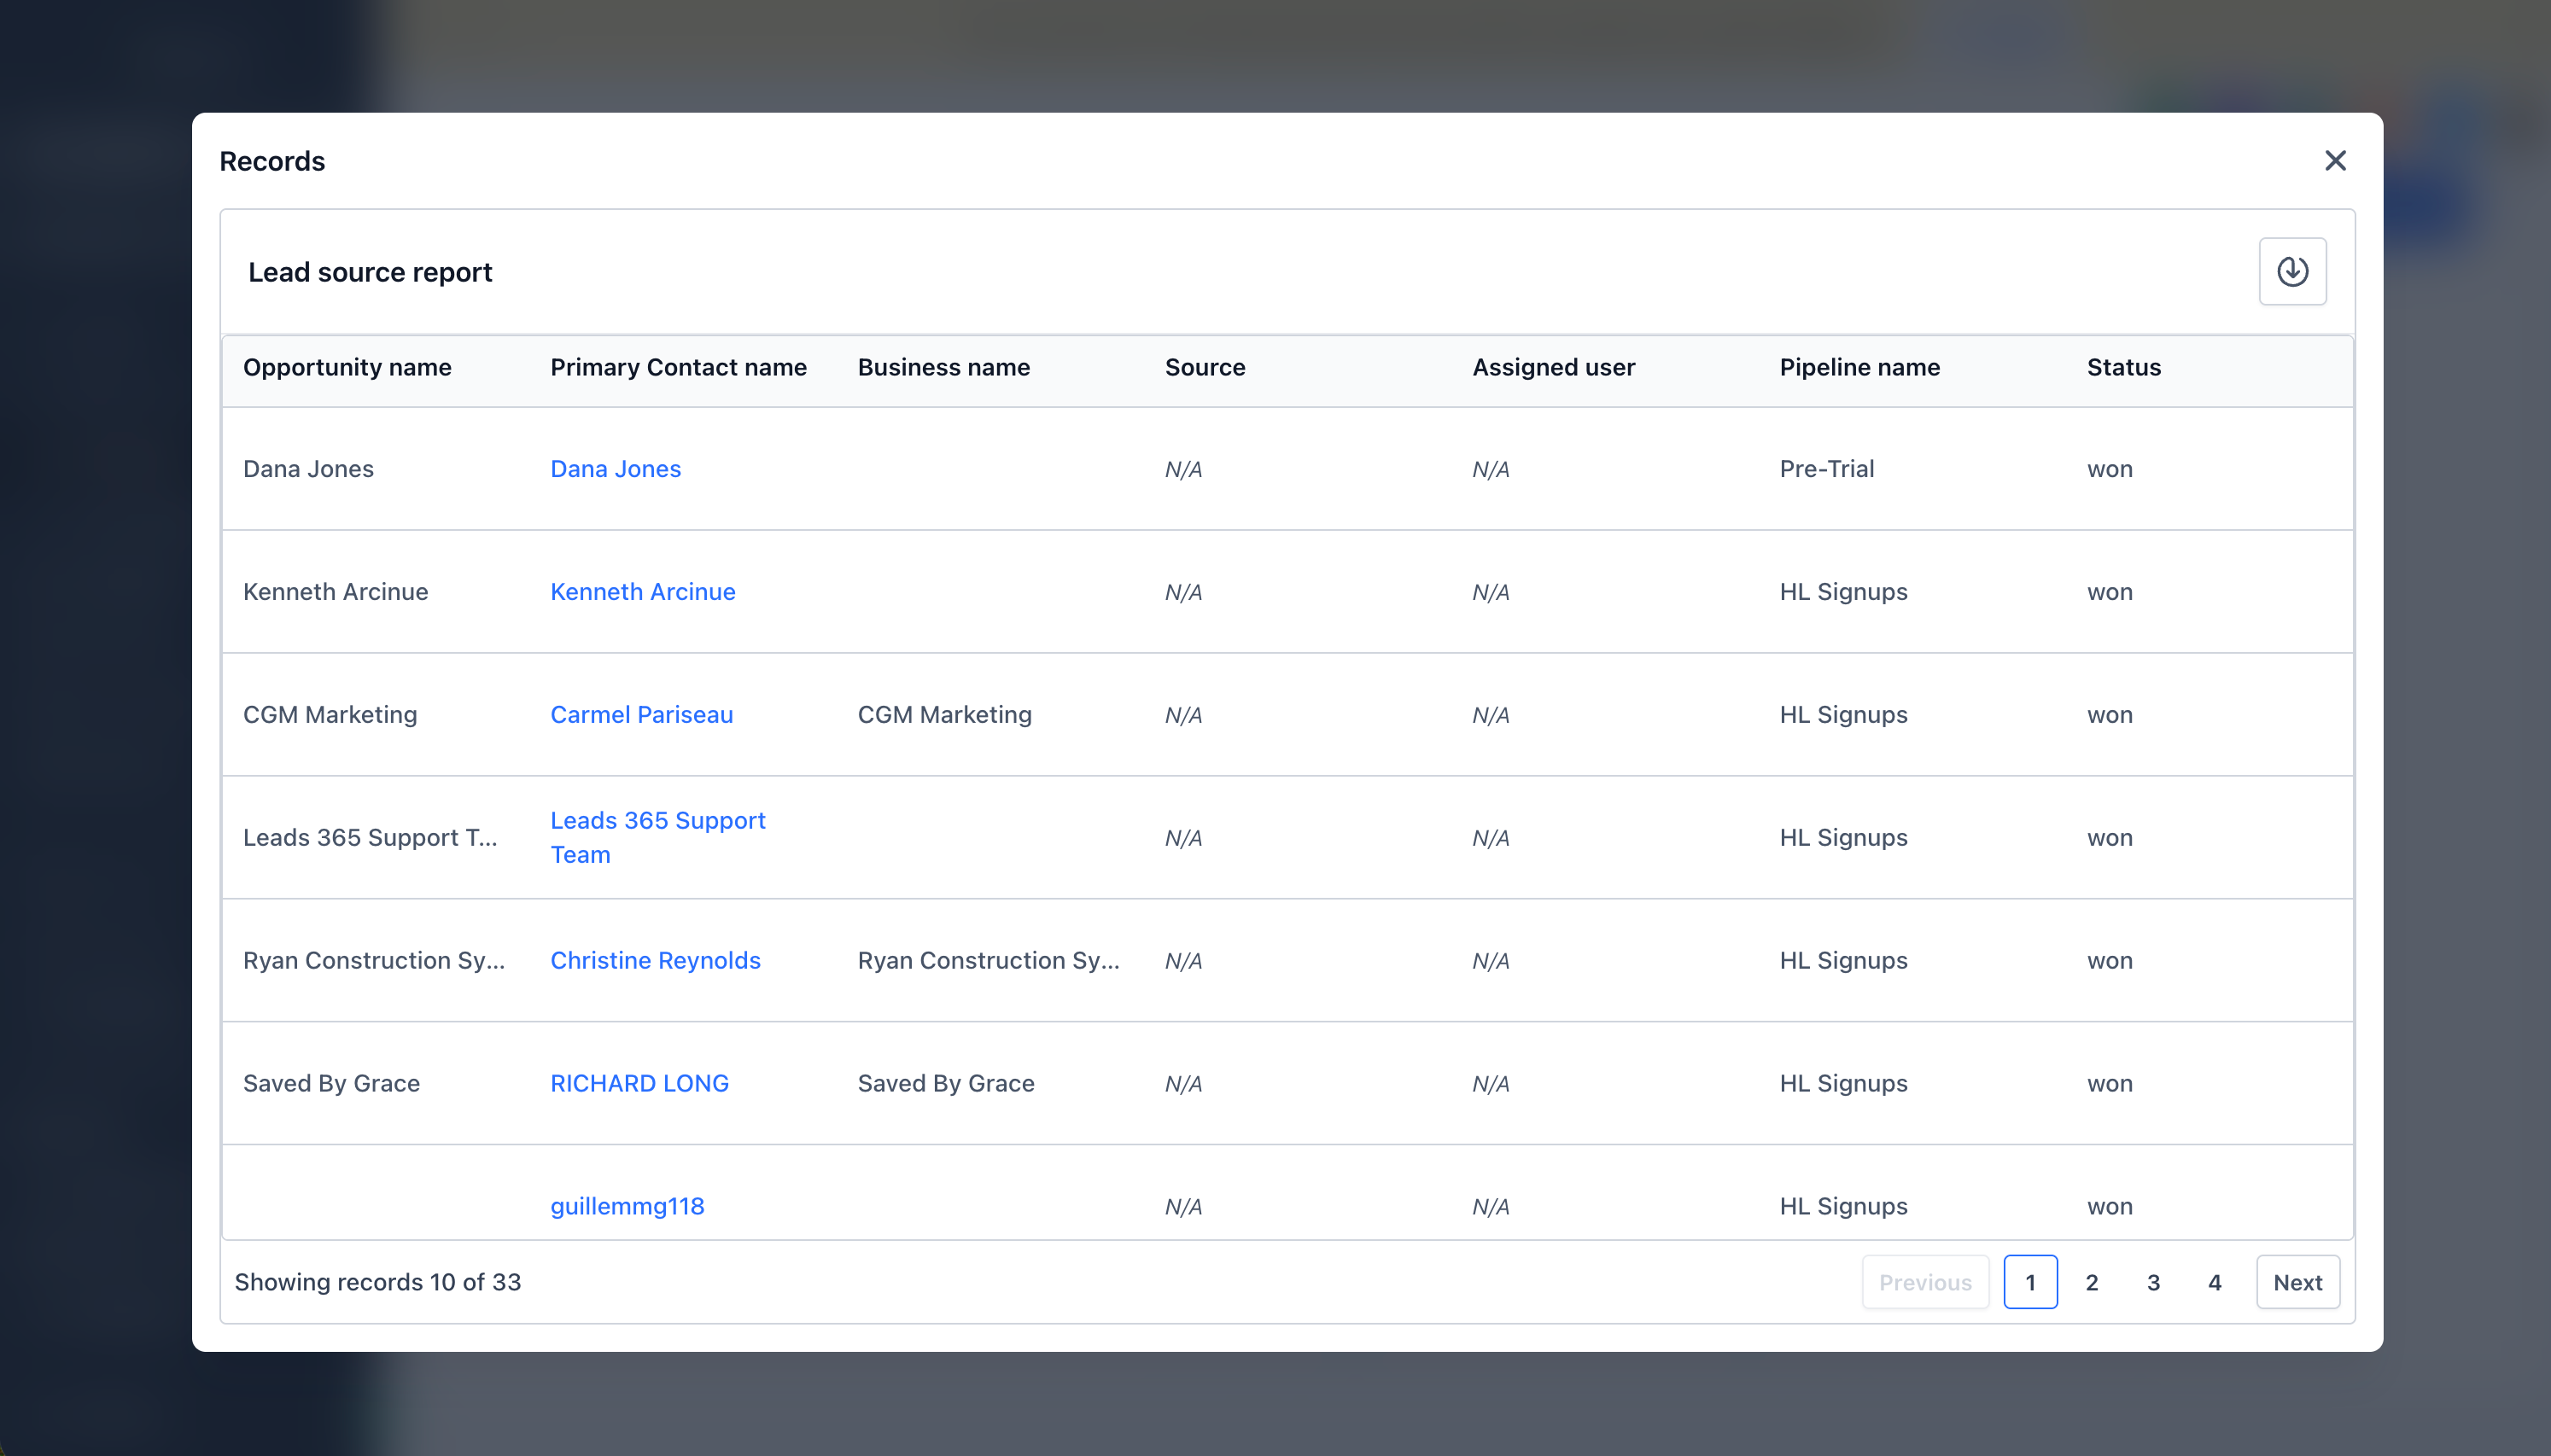
  • Drill down into any number: Click any count under Total leads, Open, Won, Lost, or Abandoned to see the exact opportunities behind it.

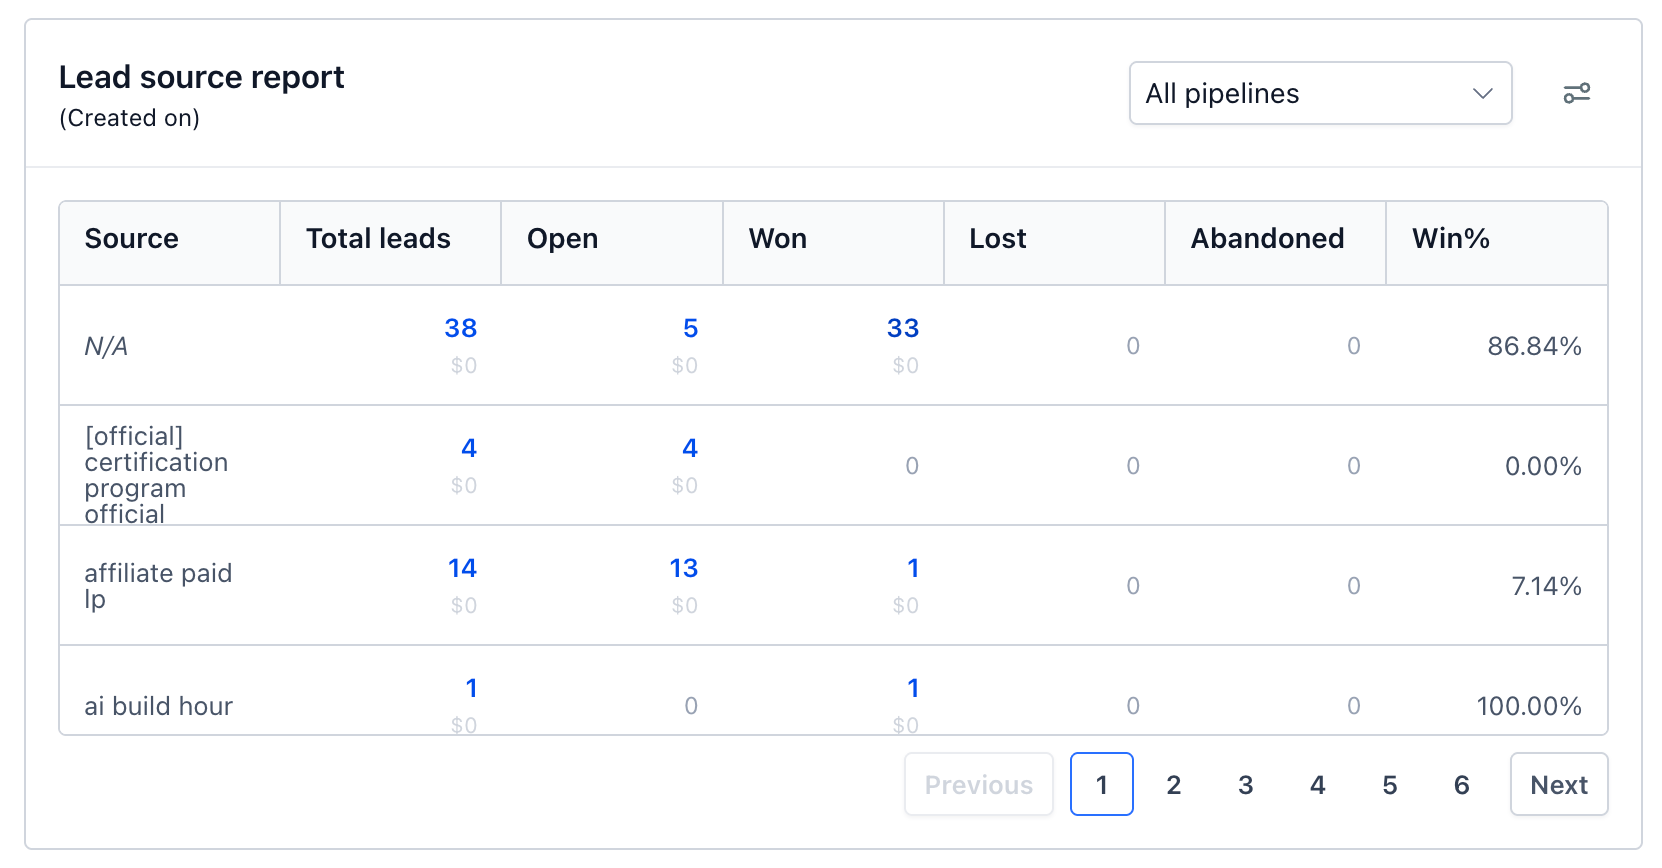
  • Value for every status: The report now shows the monetary value for Open, Won, Lost, and Abandoned, not just the total.

  • Find leads without a source: The Source filter now supports "Is empty" and "Is not empty".

  • Missing sources are visible: Opportunities without a source now appear as "N/A" instead of being left out.

  • Cleaner table layout: Rows have a consistent height and columns stay readable on smaller screens.

๐Ÿ‘ท How It Works:

  1. Add the Lead Source Report widget to your dashboard, or open one you already have.

  2. Each source row now shows both the count and the value for every status.

  3. Click any count greater than zero to open the list of opportunities that make up that number.

  4. To check data quality, filter Source by "Is empty" or review the "N/A" row to see which opportunities are missing a source.
Screenshot 2026-10-06 at 10

๐ŸŒŸ Why It Matters:

  1. From numbers to names โ€” See exactly which leads sit behind a count without leaving the report or searching manually.

  2. Know what each channel is worth โ€” Compare open, won, and lost value by source to see which channels actually bring in revenue.

  3. Trust your attribution โ€” Spot and fix opportunities with no source so your channel reporting stays accurate.

โญ๏ธ What's Next?

  • Support for using a custom field as the revenue source in the Lead Source Report.

๐Ÿ“ Notes:

  1. Values are visible only to users with permission to view lead value.

  2. Drill-down is available on any count greater than zero.
Configure and filter your general widgets in dashboards

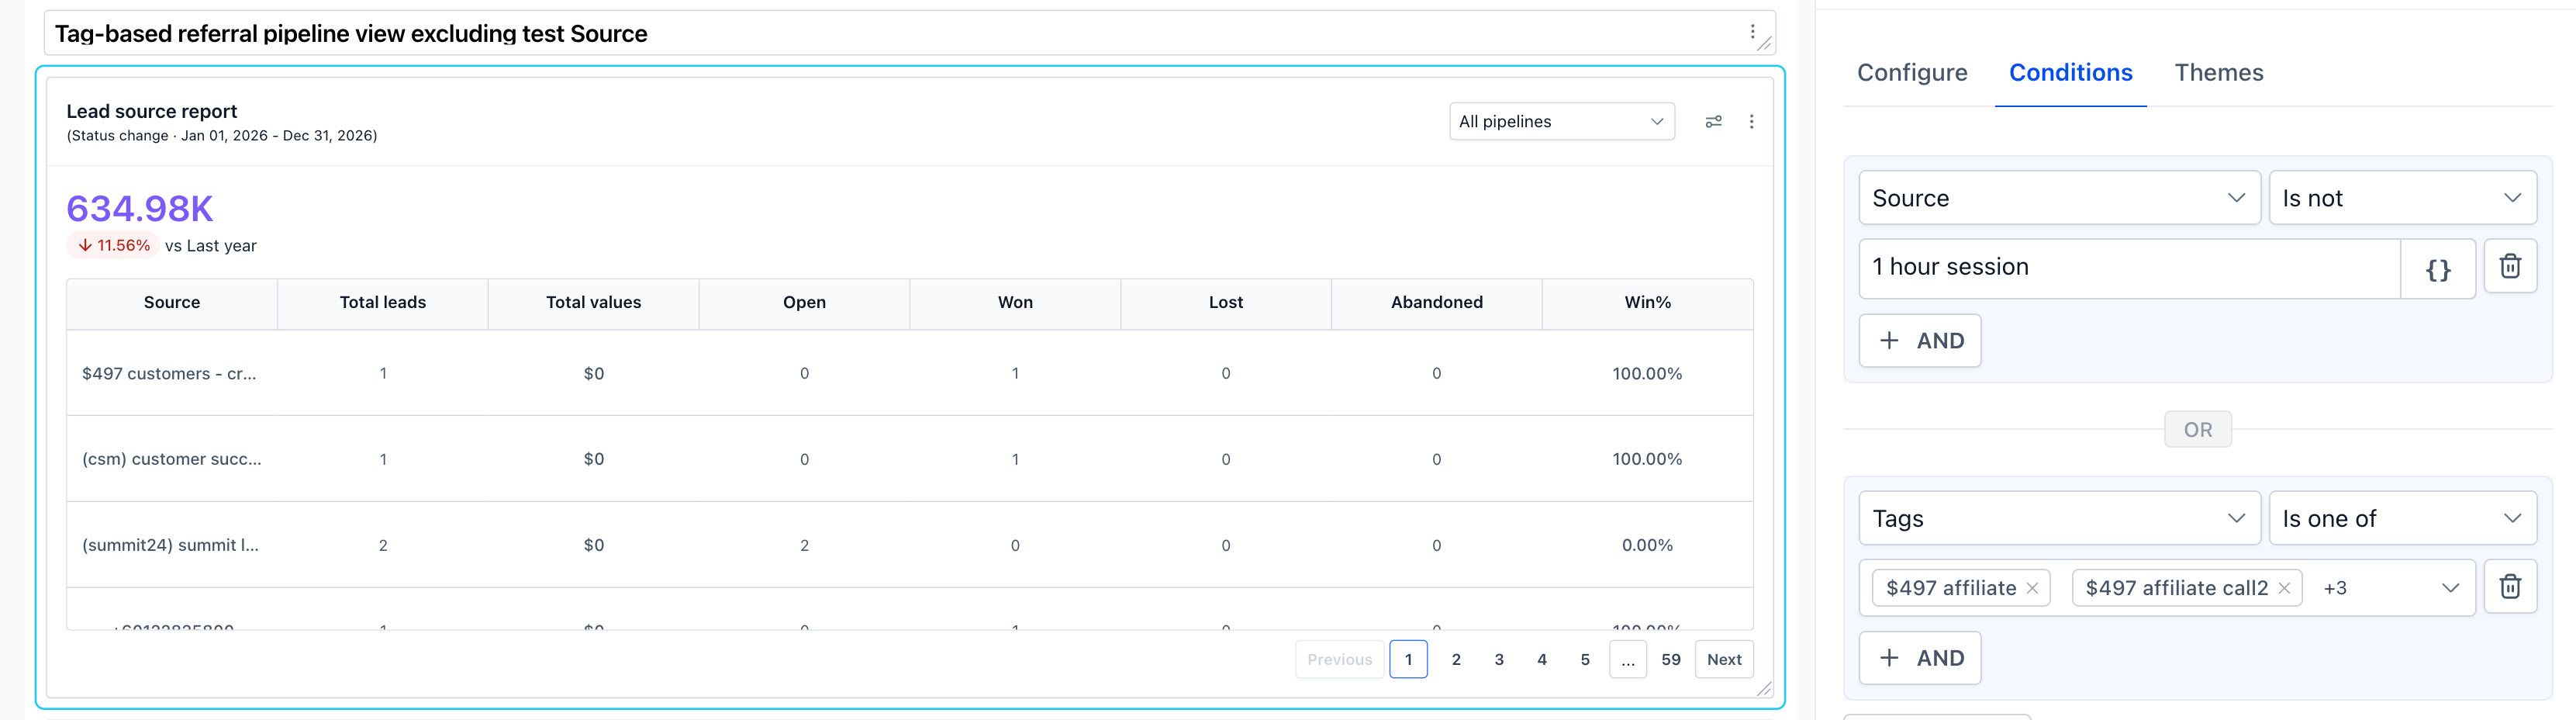
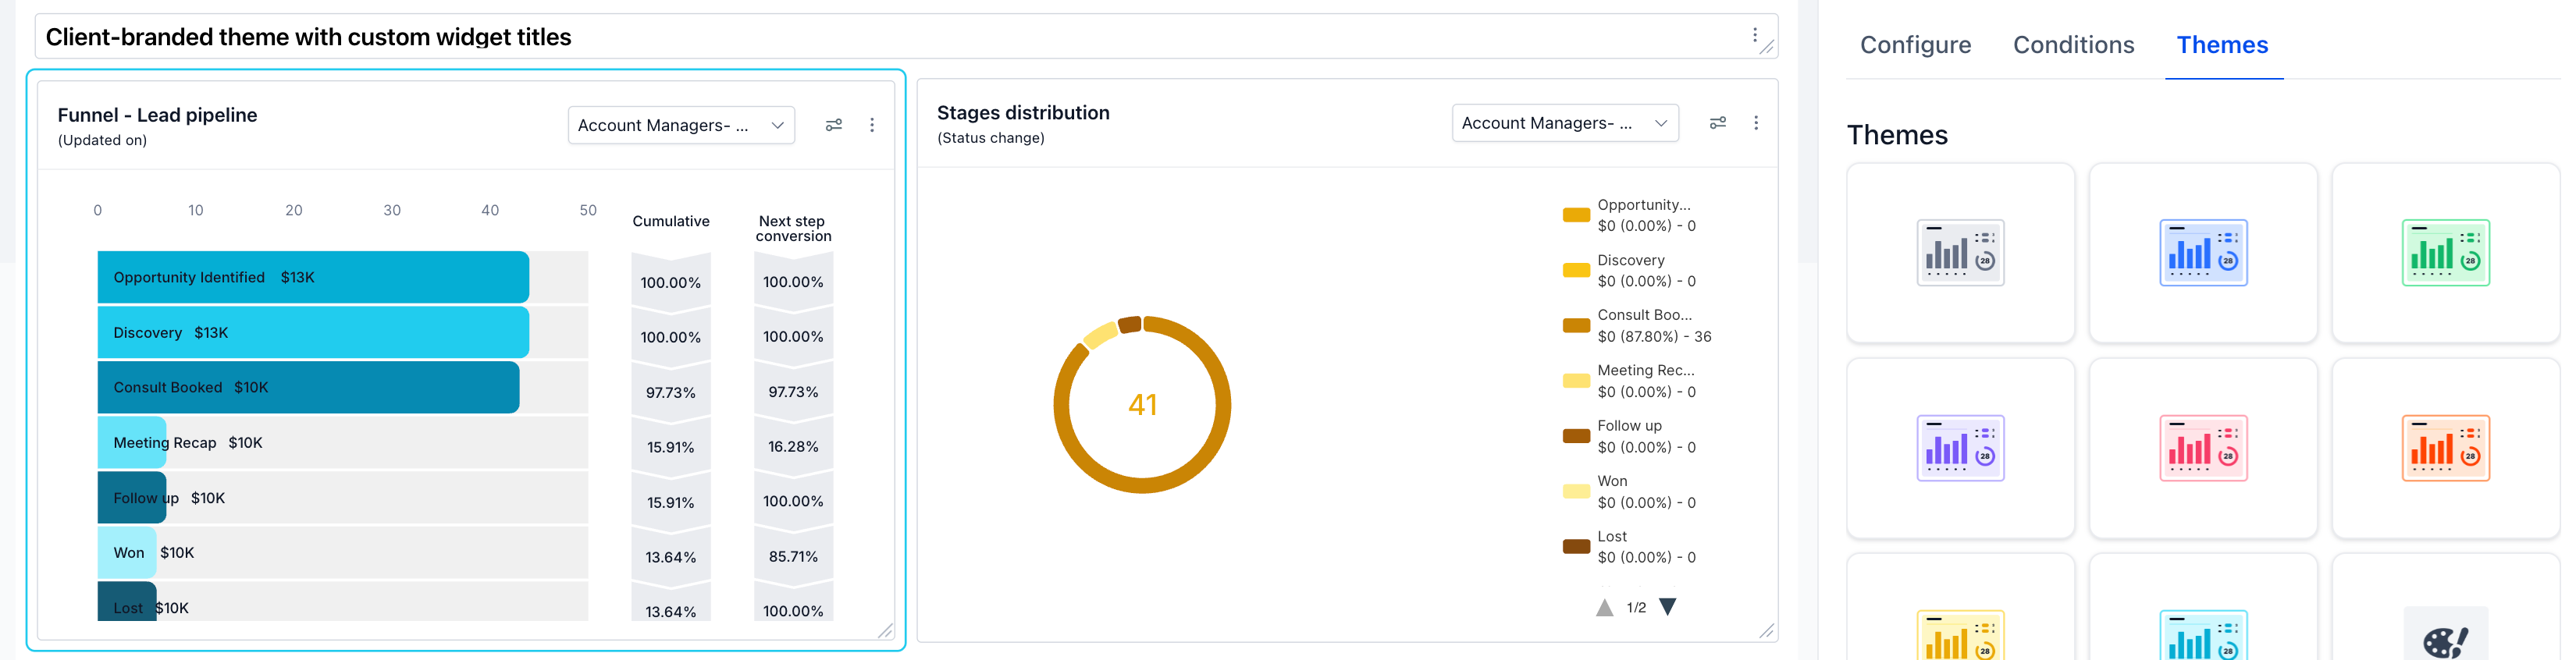
  • General Widgets on your sub-account dashboard are now editable โ€” configure what data each widget shows by adding permanent filter conditions and setting custom date ranges. Also compare performance across periods, rename widgets, apply themes, and duplicate them

  • New Conditions tab lets you permanently filter any general widget by assigned user, tags, source, lead value, custom fields, and attribution โ€” filters persist every time the dashboard is opened

  • Date range override lets you lock a widget to a specific time period, independent of the dashboard-level date filter

  • Date property and date range are now shown explicitly on each widget face so you always know what time period you are looking at

  • Comparison mode lets you see current period vs last year or last period directly on the widget

Screenshot 2026-09-24 at 7

๐Ÿ‘ท How It Works:

  • Go to Dashboard and click Edit dashboard (top right)

  • Hover over any general widget and click the three-dot menu (โ‹ฎ) โ†’ select Edit

  • In the Configure tab โ€” edit the widget title and set a date range override under Advanced Settings

  • In the Conditions tab โ€” add permanent data filters by selecting a field, operator, and value

  • In the Themes tab โ€” apply a visual theme to match your branding

  • Click Save โ€” your configuration persists every time the dashboard opens

Screenshot 2026-09-24 at 7

๐ŸŒŸ Why It Matters:

  1. Your dashboard, your data โ€” stop seeing everyone's numbers every time you open the dashboard. Set Assigned user = Logged in user once, and every team member automatically sees only their own performance.

  2. Trusted numbers โ€” the widget face now shows exactly which date property and date range it is calculating on, so two similar widgets showing different numbers no longer create confusion.

  3. Client-ready dashboards โ€” rename widgets to client-friendly language, apply a matching theme, and duplicate widgets per segment. Turn a generic dashboard into one that feels built specifically for your client.

  4. Permanent segmentation without rebuilding โ€” use custom fields, tags, or source conditions to permanently scope a widget to a specific segment. No more manual filtering every session.

  5. Year-over-year visibility โ€” lock a widget to This Year with comparison vs Last Year. Every time your client opens the dashboard, they see their growth story at a glance.

Screenshot 2026-09-24 at 7

โญ๏ธ What's Next?

  1. Configure what's shown in Funnel and Manual Actions widgets

  2. Dashboard Quick Filter support for general widgets

๐Ÿ“ Notes:

  1. Pipeline is available as a runtime filter on the widget face and is not included in Conditions.

  2. Condition fields available vary by widget type and the module it belongs to (Opportunities, Email, Contacts, etc.).

  3. General widgets do not currently respond to dashboard-level Quick Filters.

  4. Full guide and use cases: Configure and Filter General Widgets

Turn your custom fields into real metrics in dashboards and custom reports

๐Ÿ‘€ What's New?

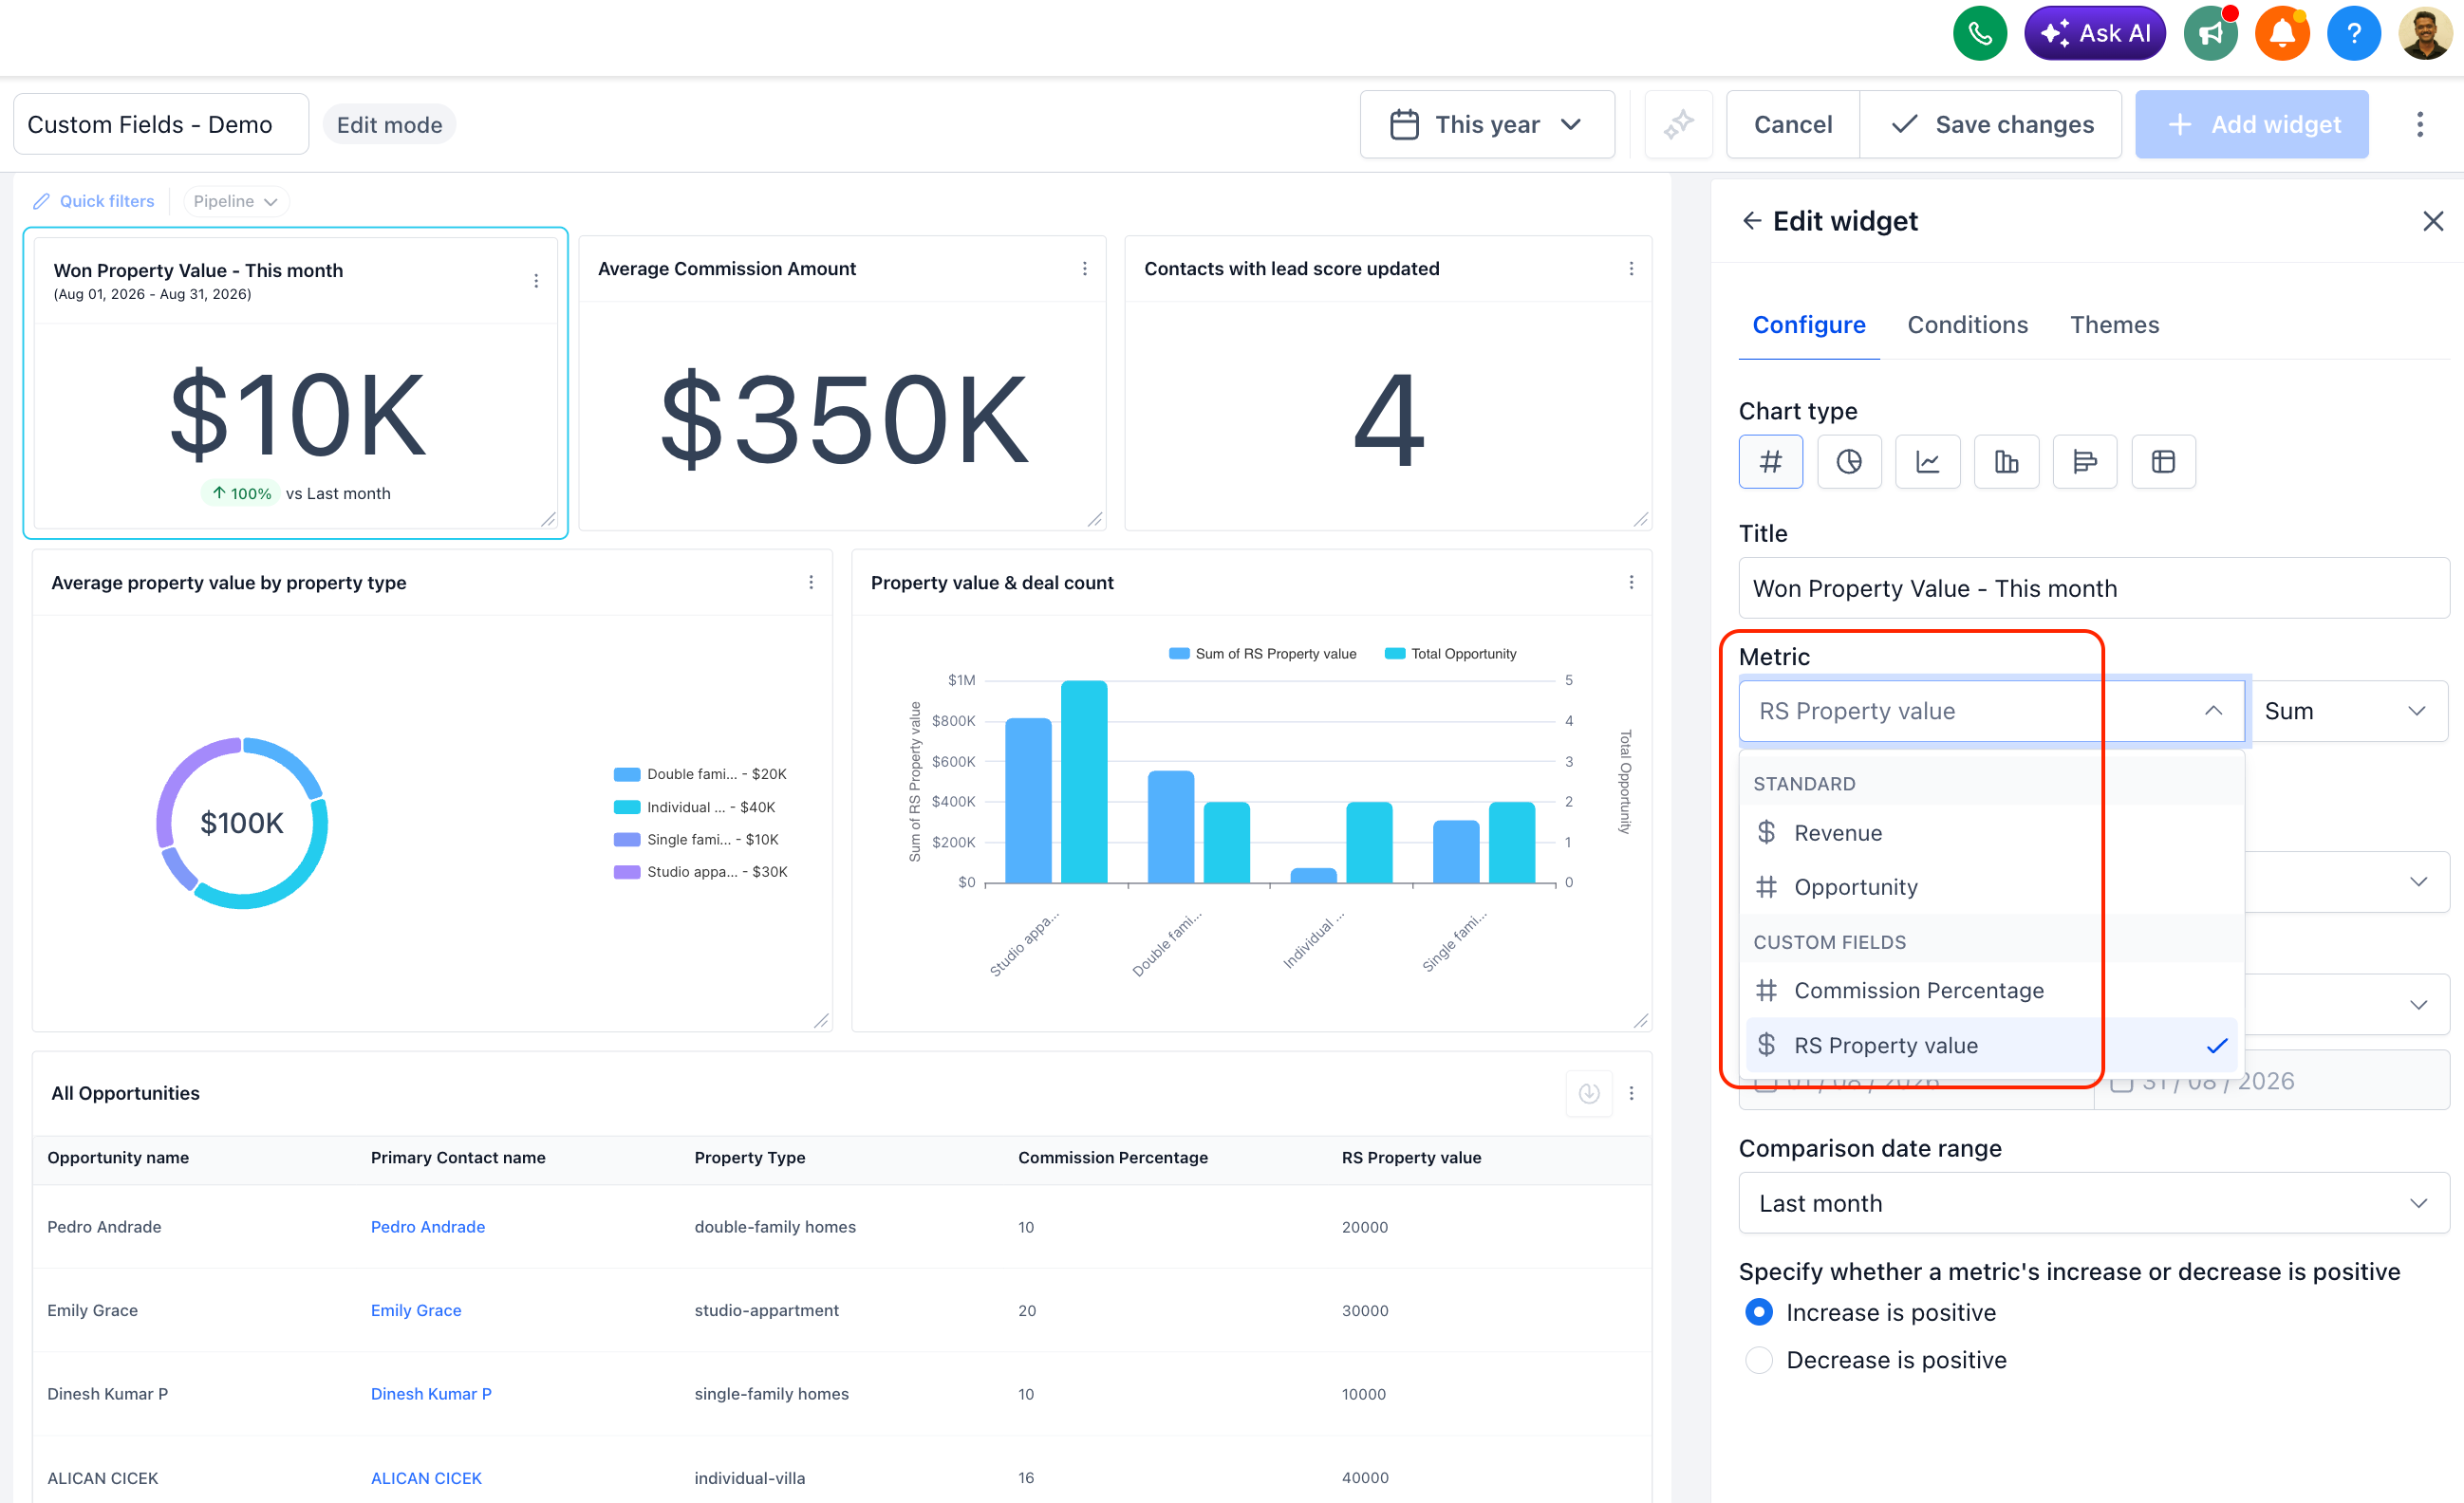
  • Numeric and monetary custom fields on Contacts and Opportunities can now be used as metrics โ€” not just filters or groupings.

  • Aggregate them with Sum, Min, Max, or Average.

  • Available everywhere metrics live: Dashboard widgets, Custom Reports, and the Custom Metric module.

  • Any new custom field you create shows up in the metric picker automatically โ€” no setup required.

๐Ÿ‘ท How It Works:

  1. Open a dashboard widget, custom report, or the Custom Metric module and go to add a metric.

  2. In the Field dropdown, select any numeric or monetary custom field (e.g., "Property Value") โ€” it now appears alongside your standard fields.

  3. In the Aggregation dropdown, choose Sum, Min, Max, or Average.

  4. Your widget or report now reflects that custom field's aggregated value, live.

๐ŸŒŸWhy It Matters:

  1. Report on what actually matters to your business โ€” if you've been tracking deal size, treatment cost, property value, or any other custom number, you can now build real dashboards around it instead of exporting to a spreadsheet.

  2. No more manual math โ€” Sum, Min, Max, and Average are calculated for you, live, instead of being tallied by hand.

  3. Zero setup โ€” new custom fields are metric-ready the moment you create them.

๐Ÿ“ Note:

  • Applies to numeric and monetary custom field types in Contacts and Opportunities.

Screenshot 2026-08-23 at 10

Earlier updates