August 11th, 2025
New
Dashboards and Reporting
Sub-Account Dashboard: Custom Metrics
Build the KPIs you actually care about. Custom Metrics let you combine numbers from across your data sources, run calculations, and drop the result straight into dashboards and reports.
👀 What’s New?
Create custom KPIs by mixing metrics from multiple sources (e.g., contacts, opportunities ).
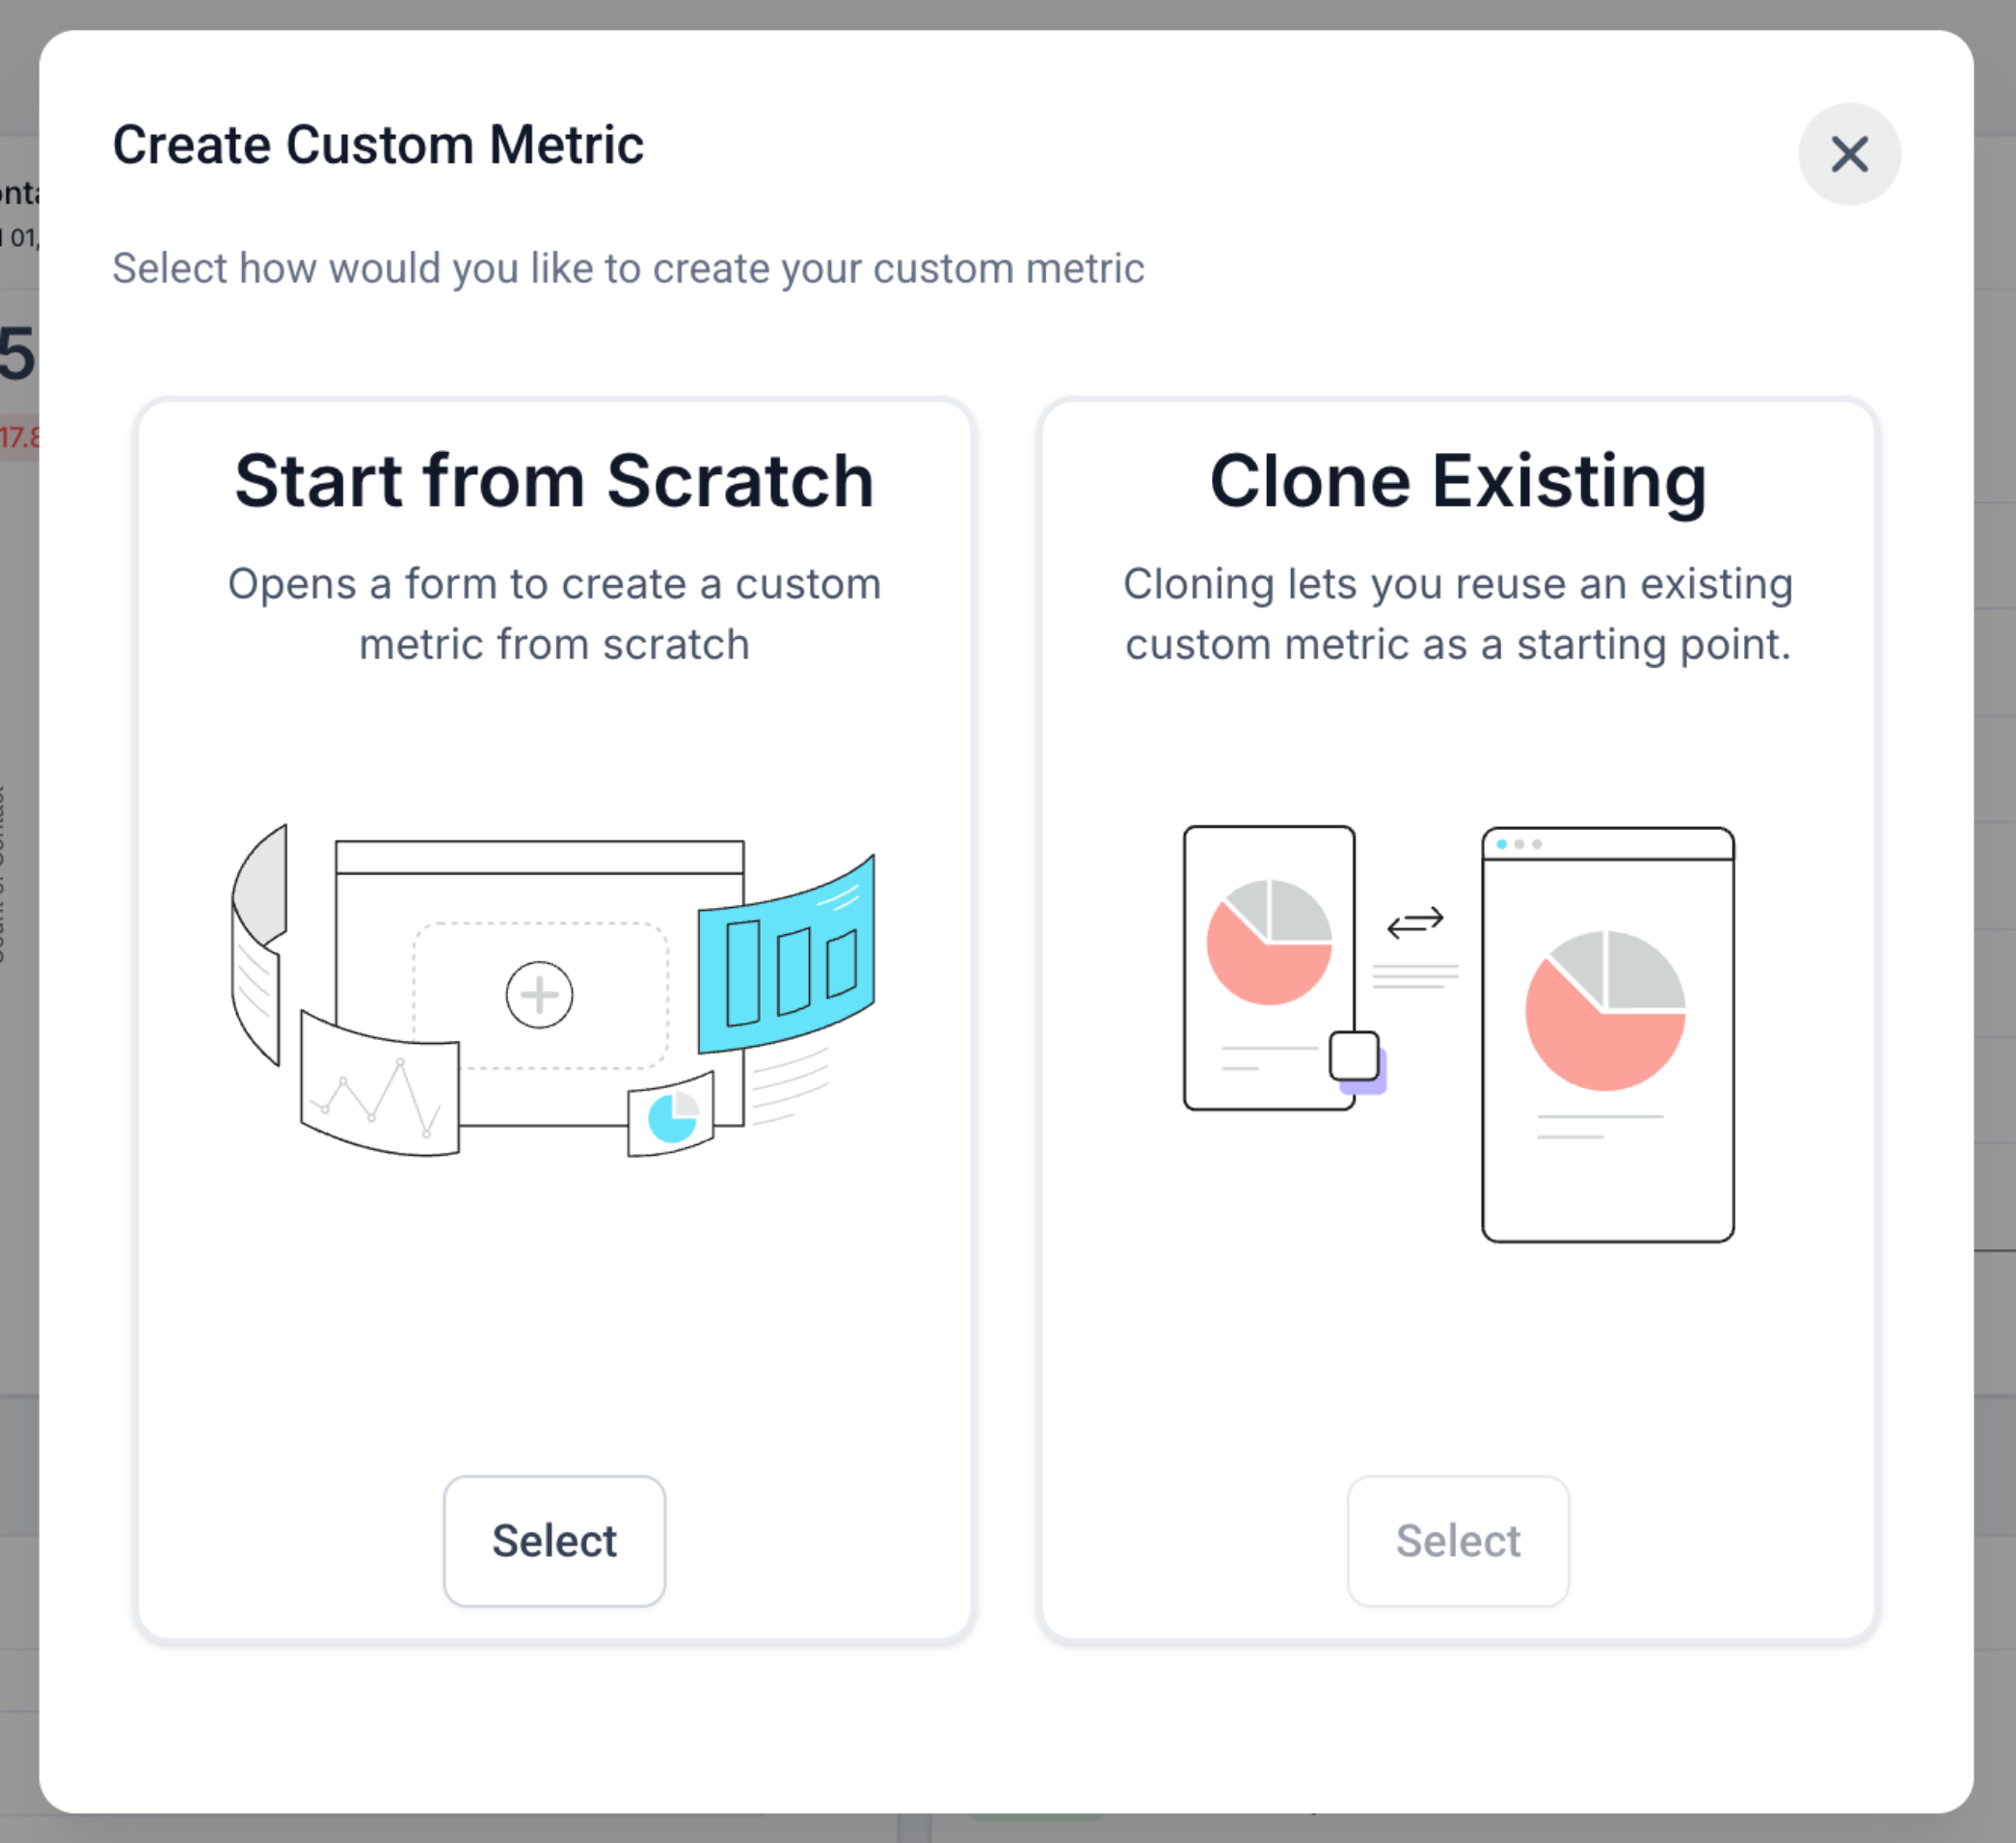
Two ways to start: build from scratch or clone an existing metric.
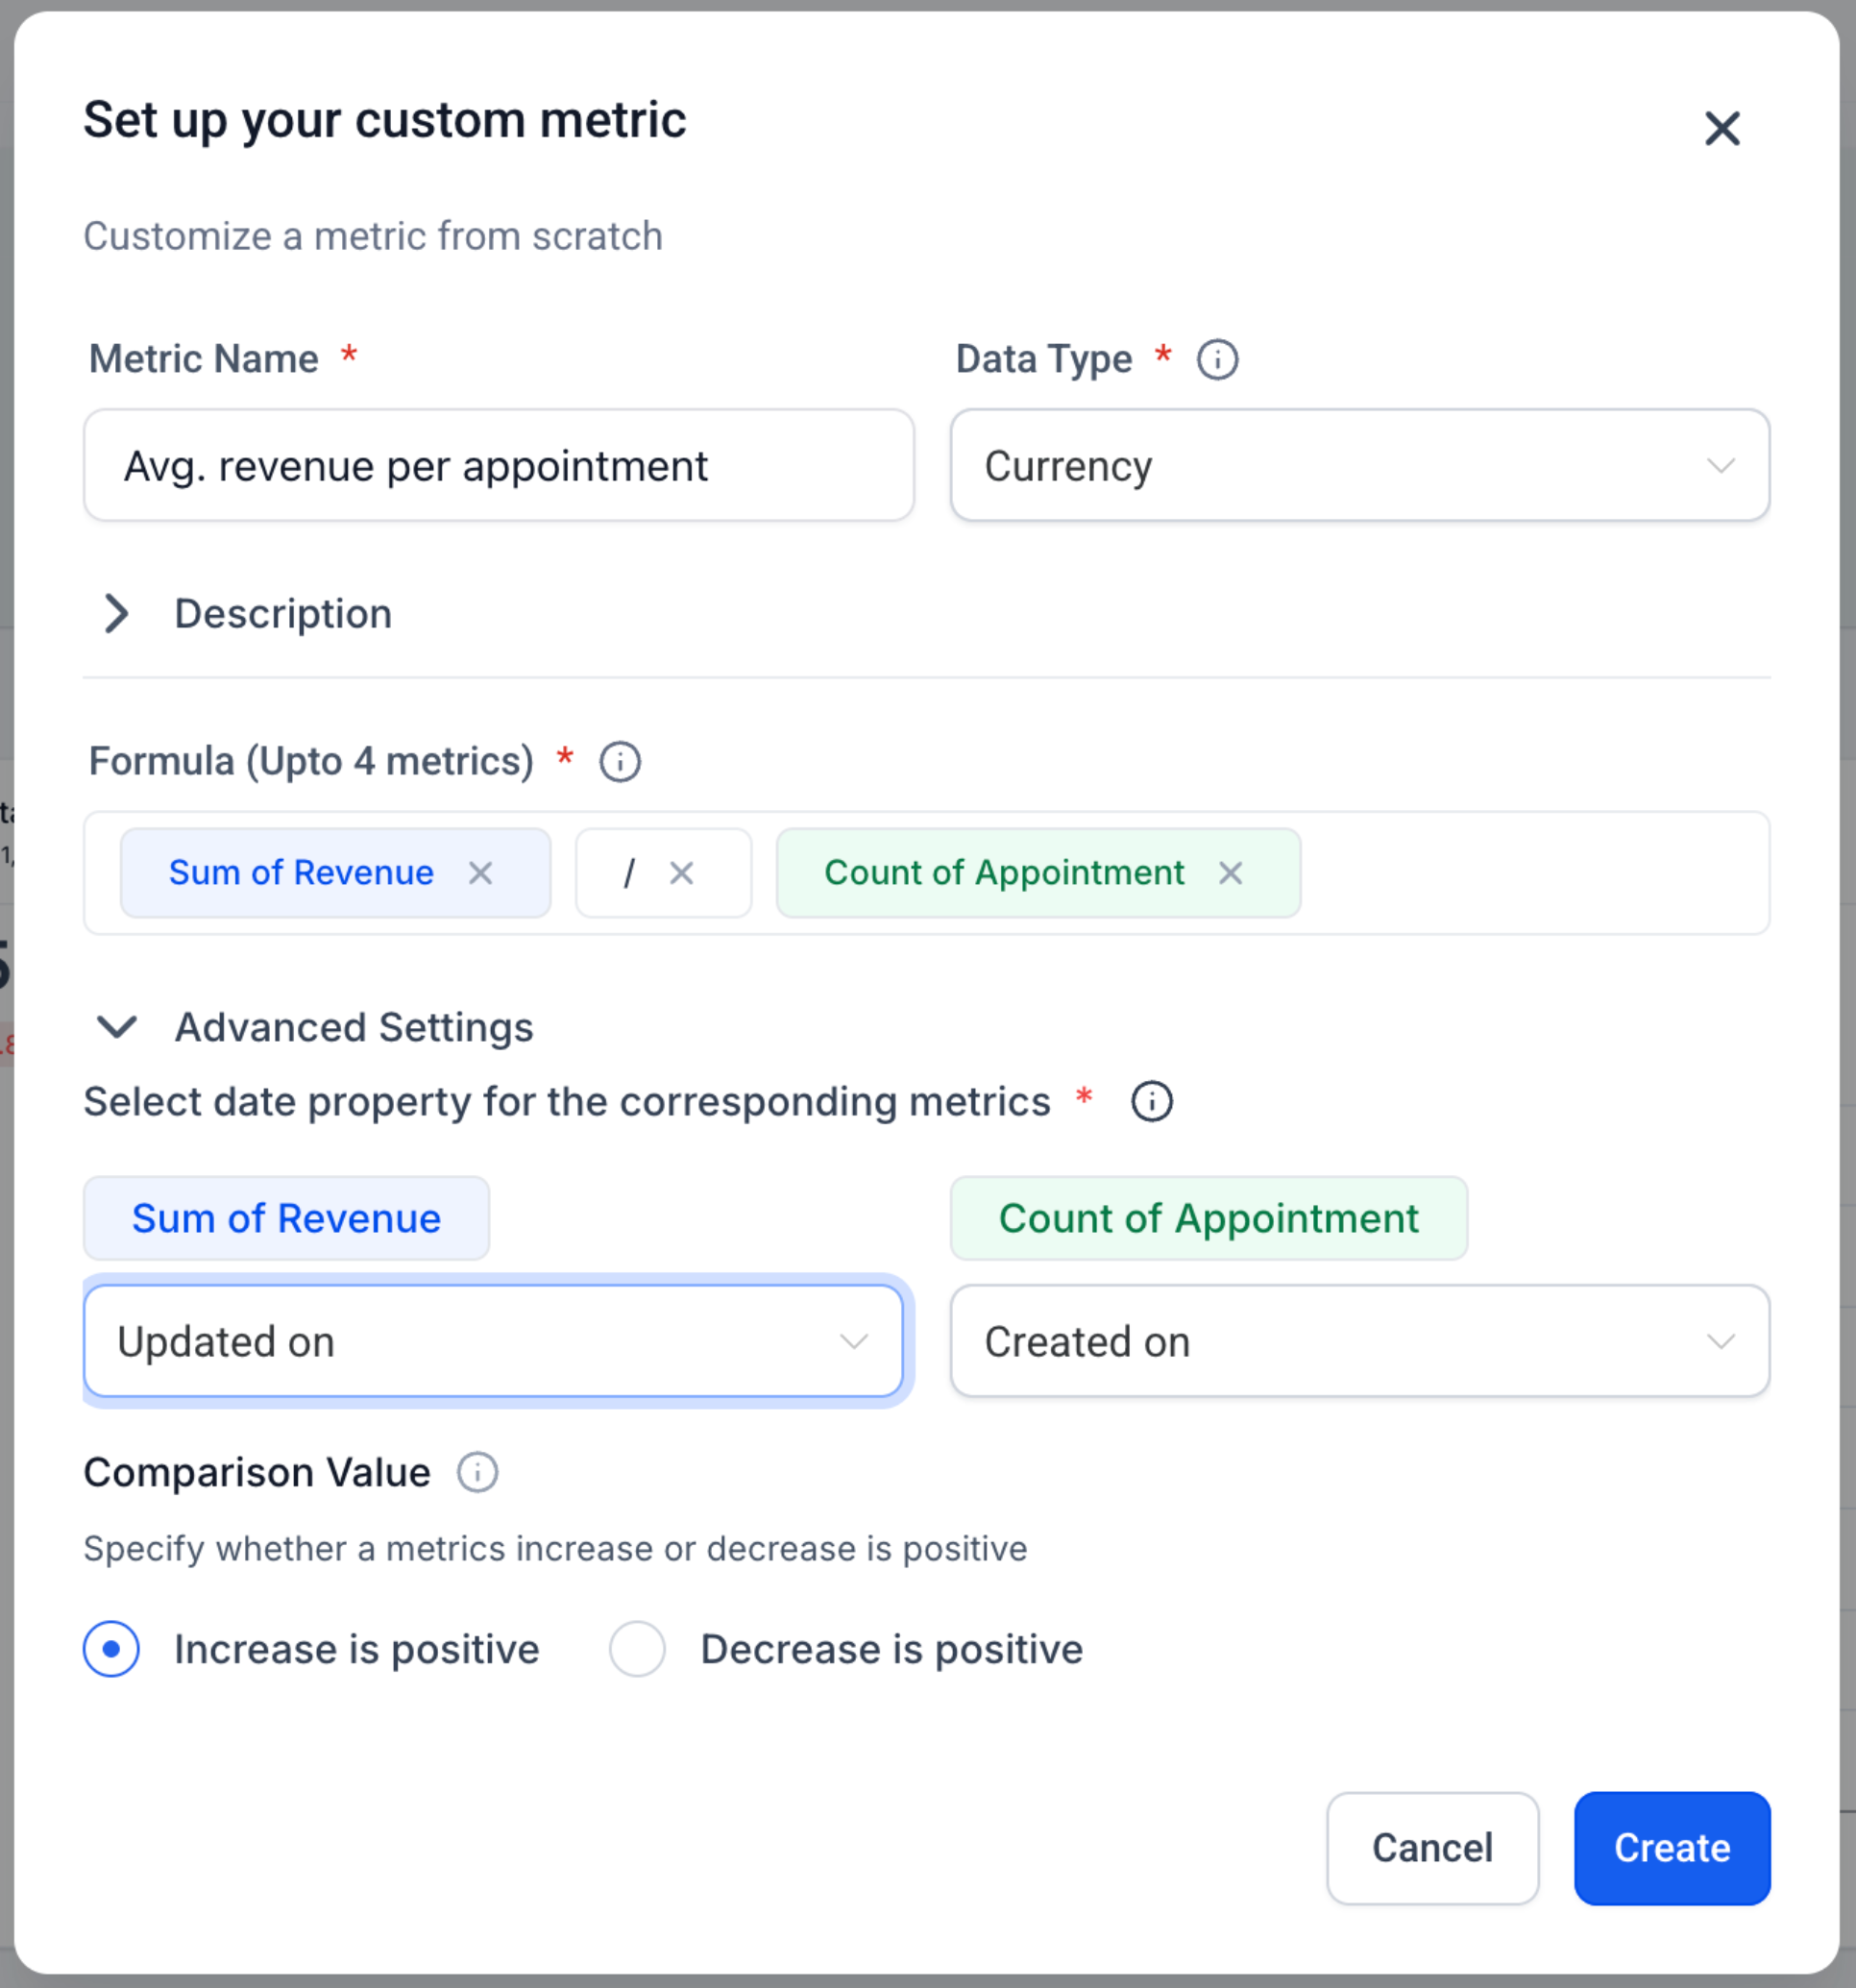
Smart formula editor with live validation, operators, and numeric constants.
Display types: Integer, Float, Currency, or Percentage
Trend direction control: mark increases as positive or negative for that metric.
Works everywhere: add as a widget to Dashboards and Custom Reports; Snapshots supported.
Chart options: rename, theme, and (optional) compare to previous period before saving.
👷 How It Works:
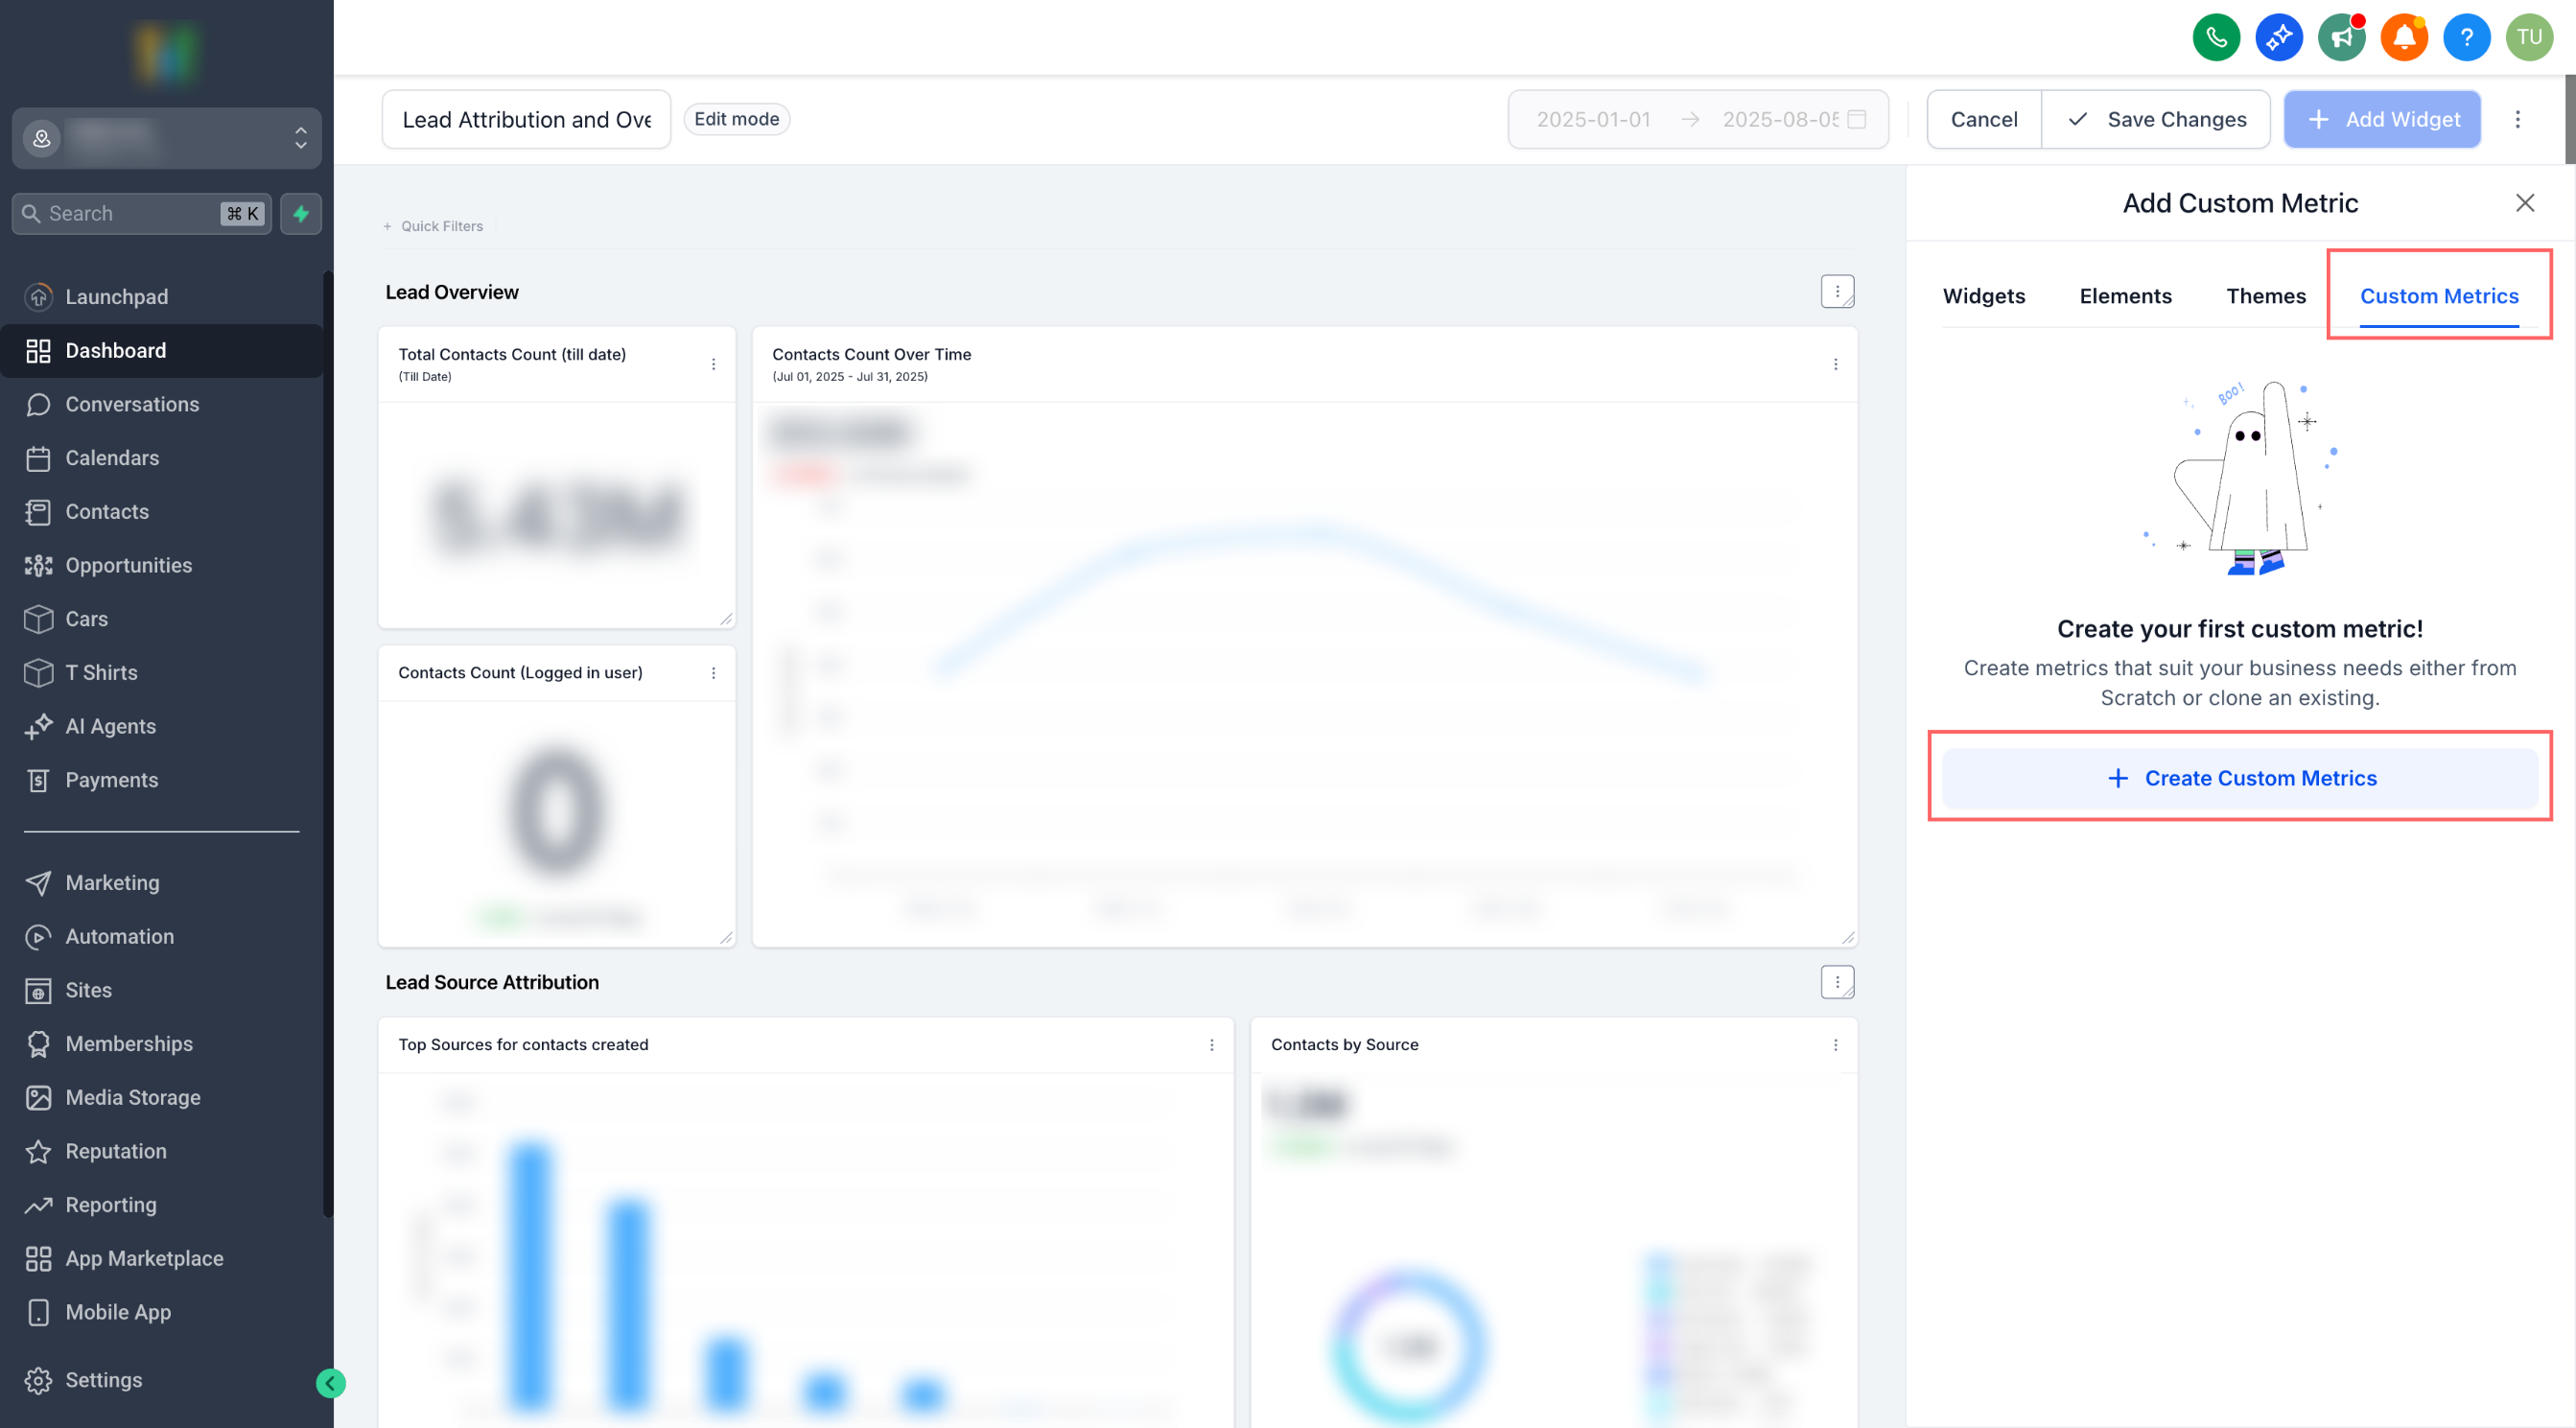
Go to a Dashboard (or Custom Report) → Edit → Add widget → Custom metric tab.
Click Create Custom Metric → pick From scratch or Clone.
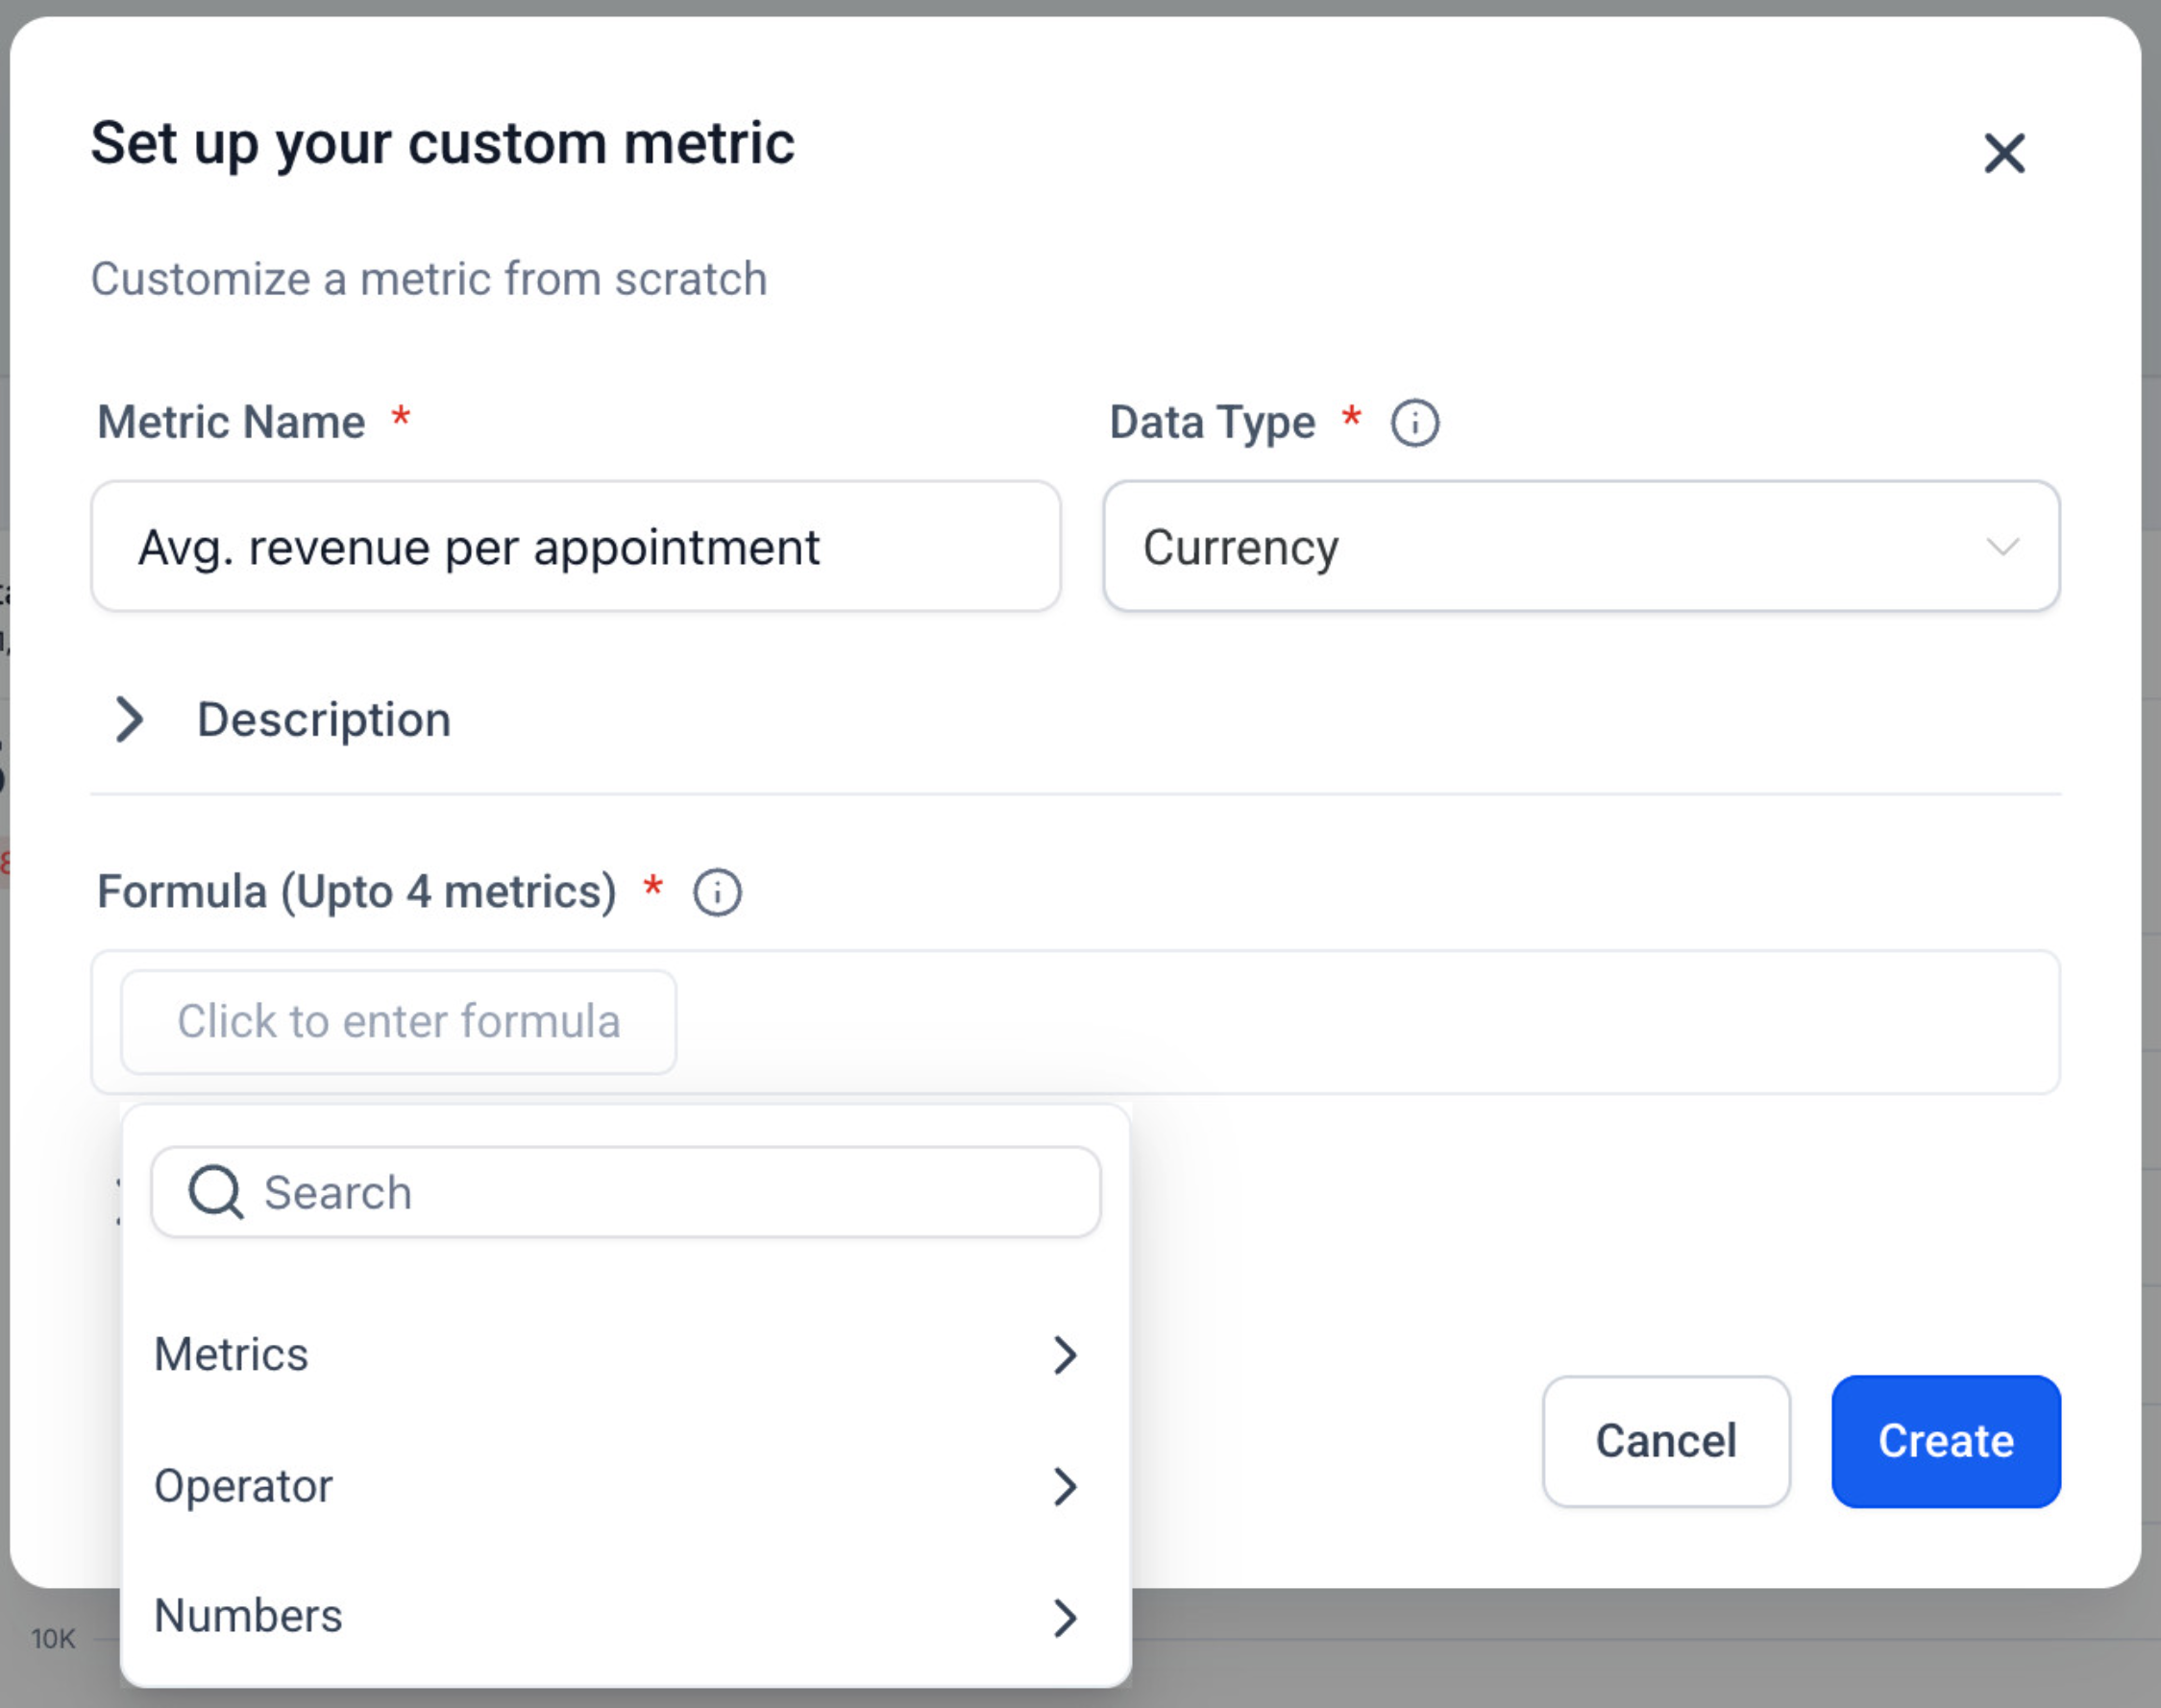
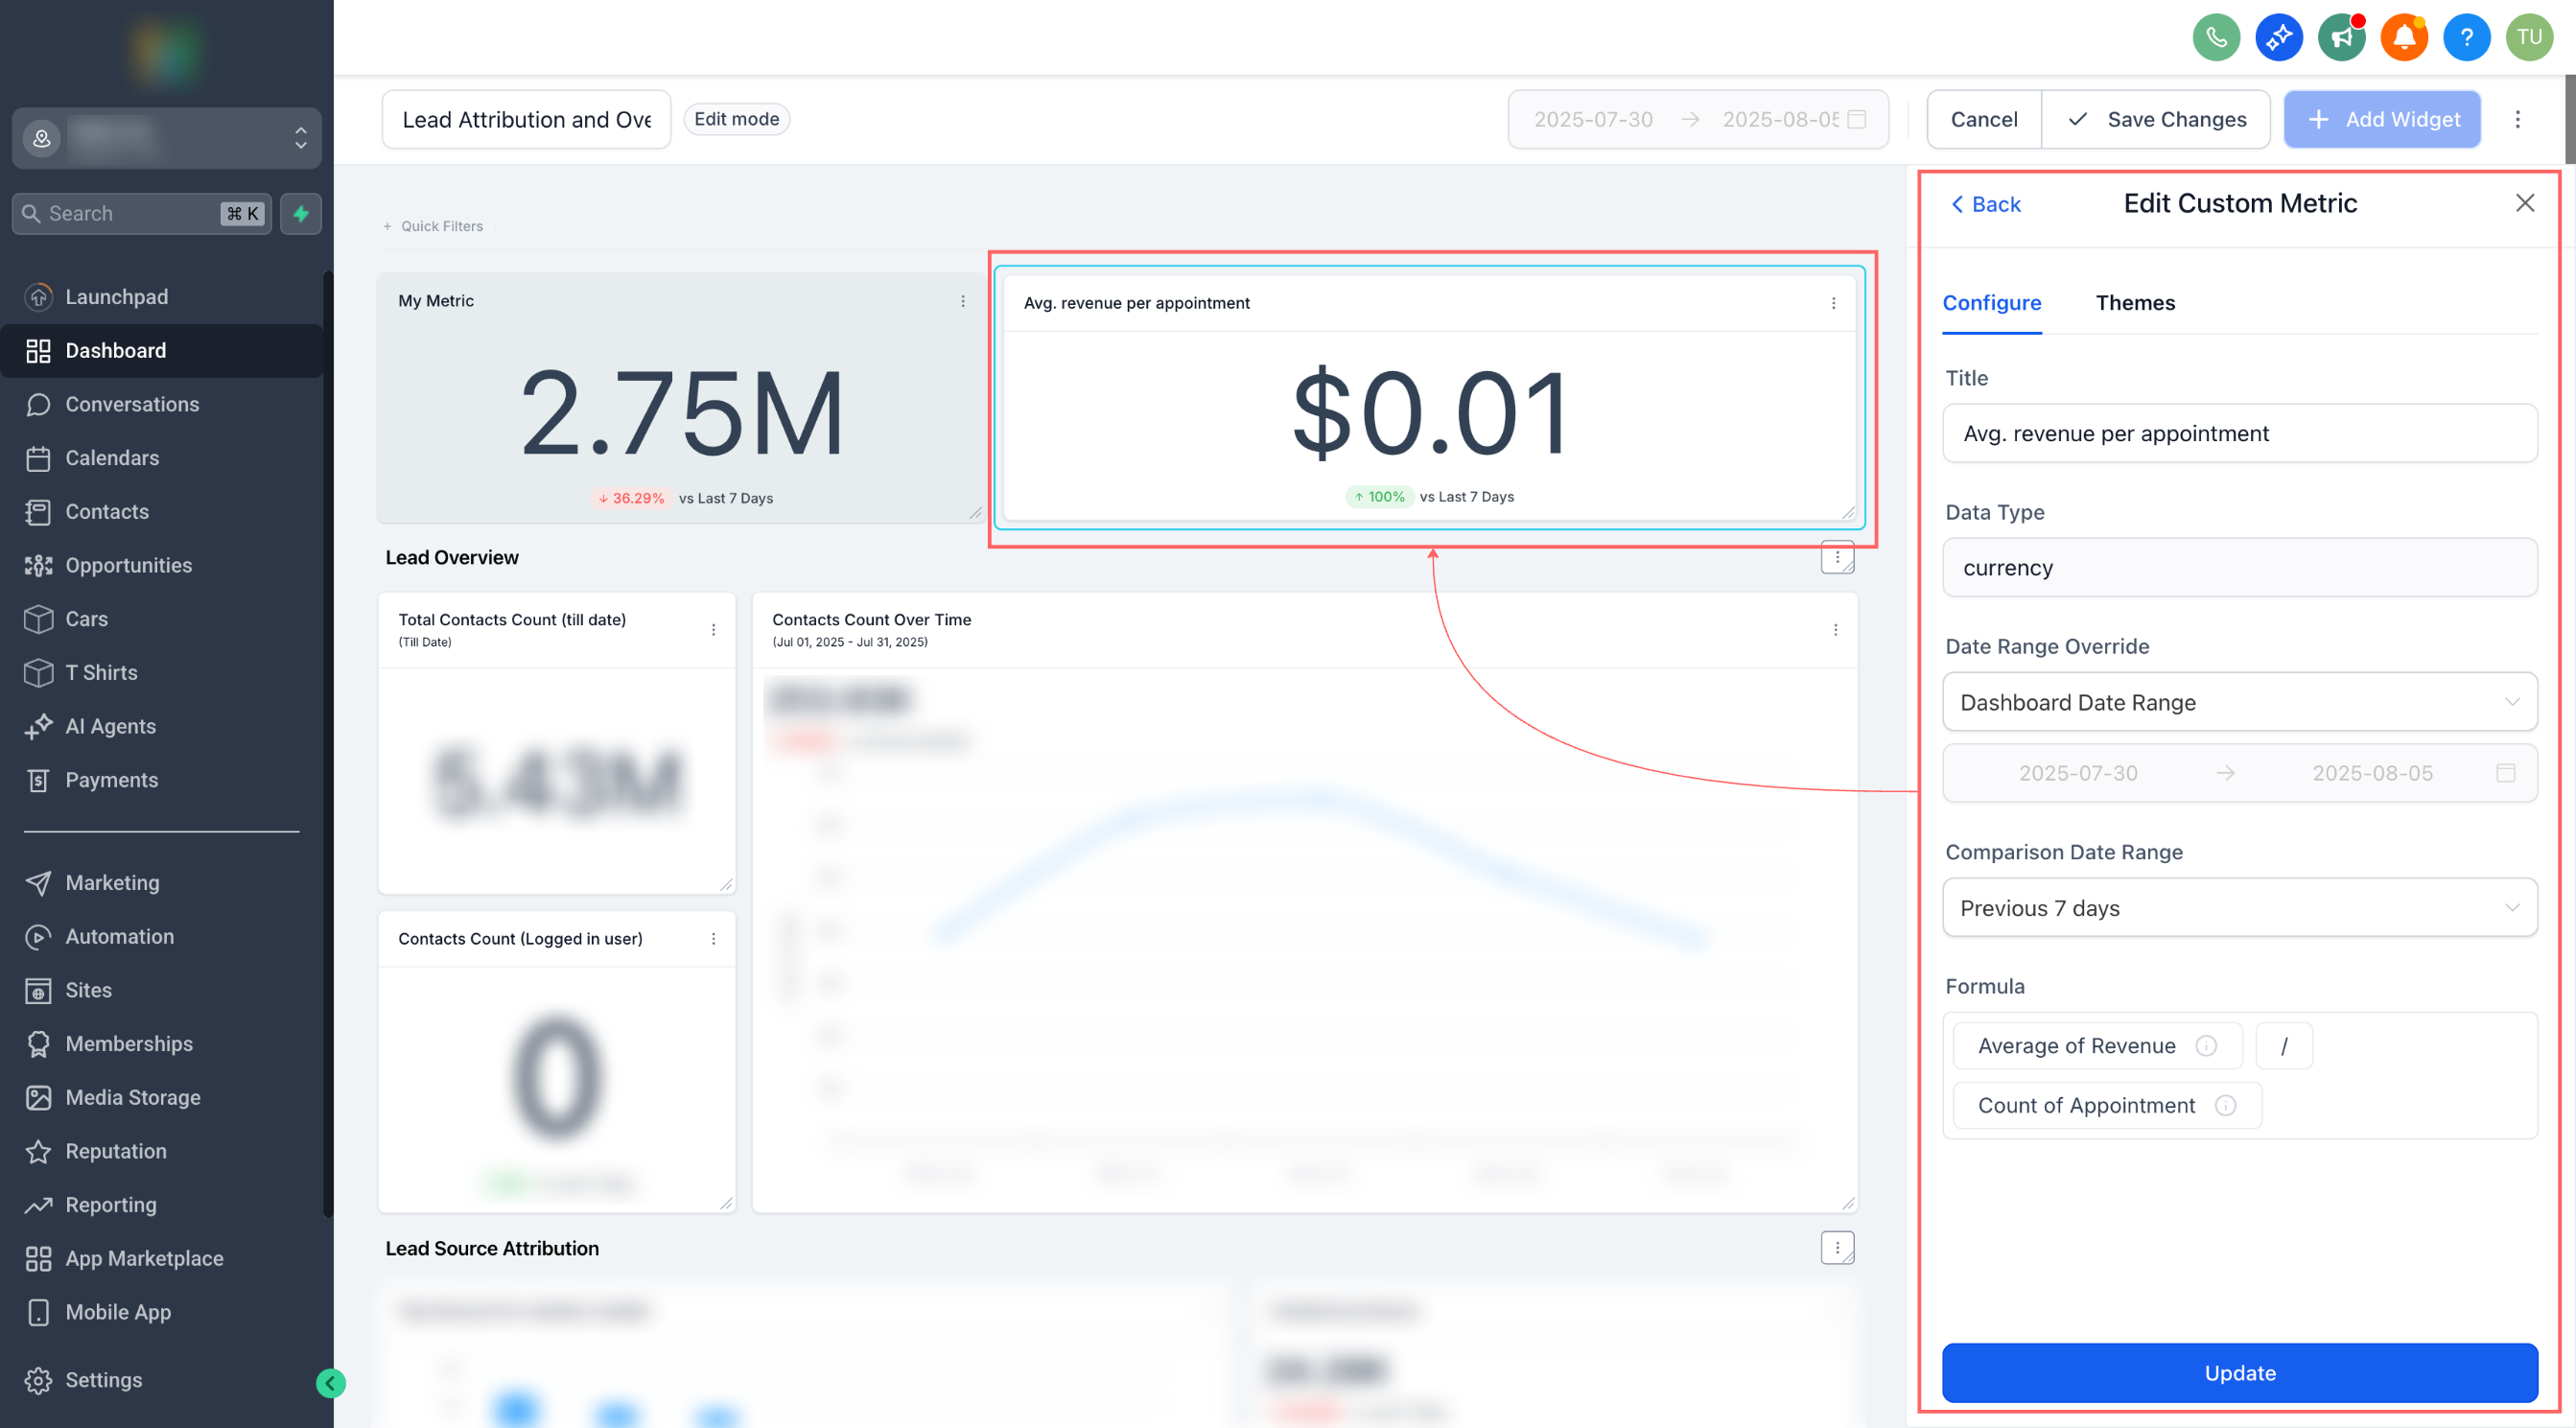
Fill in Name, Data Type, Description, and Trend direction.
In Formula, type to insert metrics (choose data source + metric), add operators and numbers.
Create → select your new metric as a widget → configure chart → Save.
⭐ Why it Matters:
No more cobbling together spreadsheets just to answer “Are we growing efficiently?” Custom Metrics pull cross-tool signals into a single KPI, so teams can align on the exact definitions that drive the business.
⏭️ What’s Next
Metric-level filters & properties in the formula. Example: Count of contacts (WHERE Tag = "VIP") / Count of contacts(WHERE Source = "Ads").
Click here for the detailed help doc