January 21st, 2026
New
Funnels & Websites
Analytics for External Tracking
Overview
We’ve introduced Analytics for External Tracking, giving users native visibility into visitor behavior on externally hosted sites and forms (both native and HTML-based).
This release adds a centralized analytics dashboard to track page views, form views, responses, and completion rates, with detailed filtering and audience breakdowns.
✨ What’s New
Analytics Access
Added a new Analytics button inside the External Tracking modal
Clicking the button redirects users to Site Analytics with External Tracking preselected
The External Tracking option appears in the analytics dropdown only when the tracking script is connected
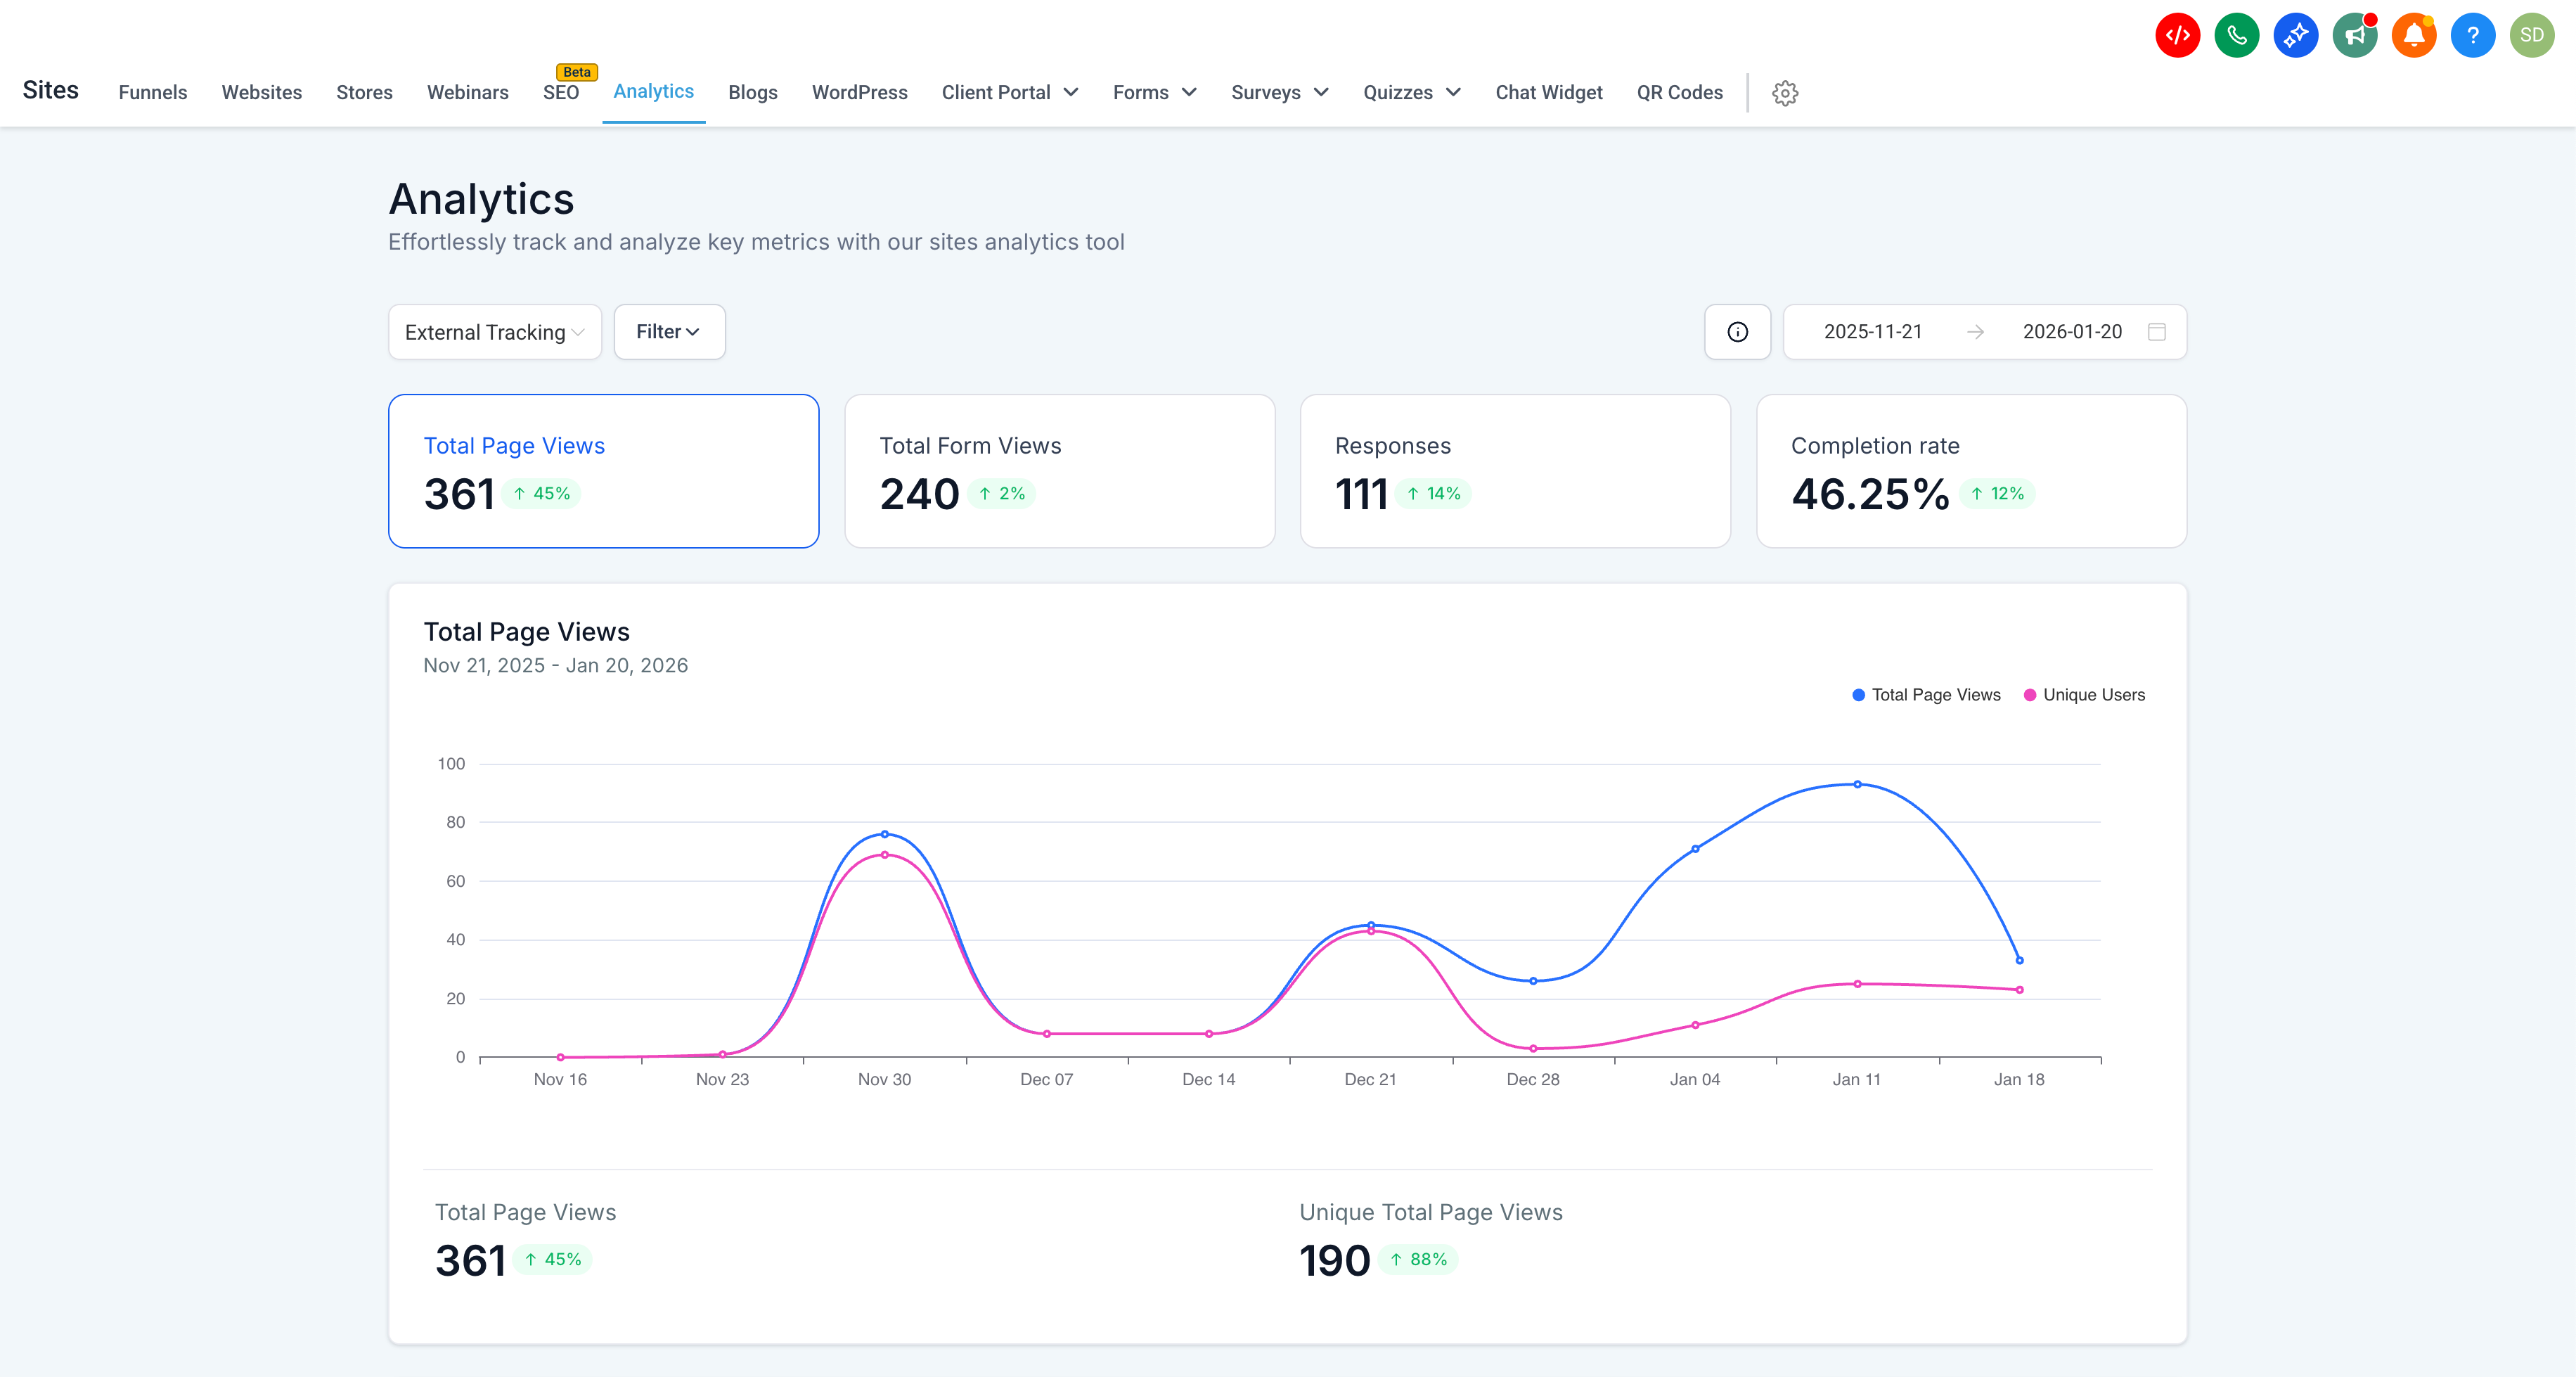
External Tracking Analytics Dashboard
Users now get a dedicated analytics view with:
Total Page Views
Total Form Views
Responses
Completion Rate
Time-Based Insights
Date range selector to analyze trends over time
Line charts with daily breakdowns for: Page Views, Form Views. Responses, Completion Rate
Engagement Metrics
Average Time on Page
Exit Before 30s (bounce rate)
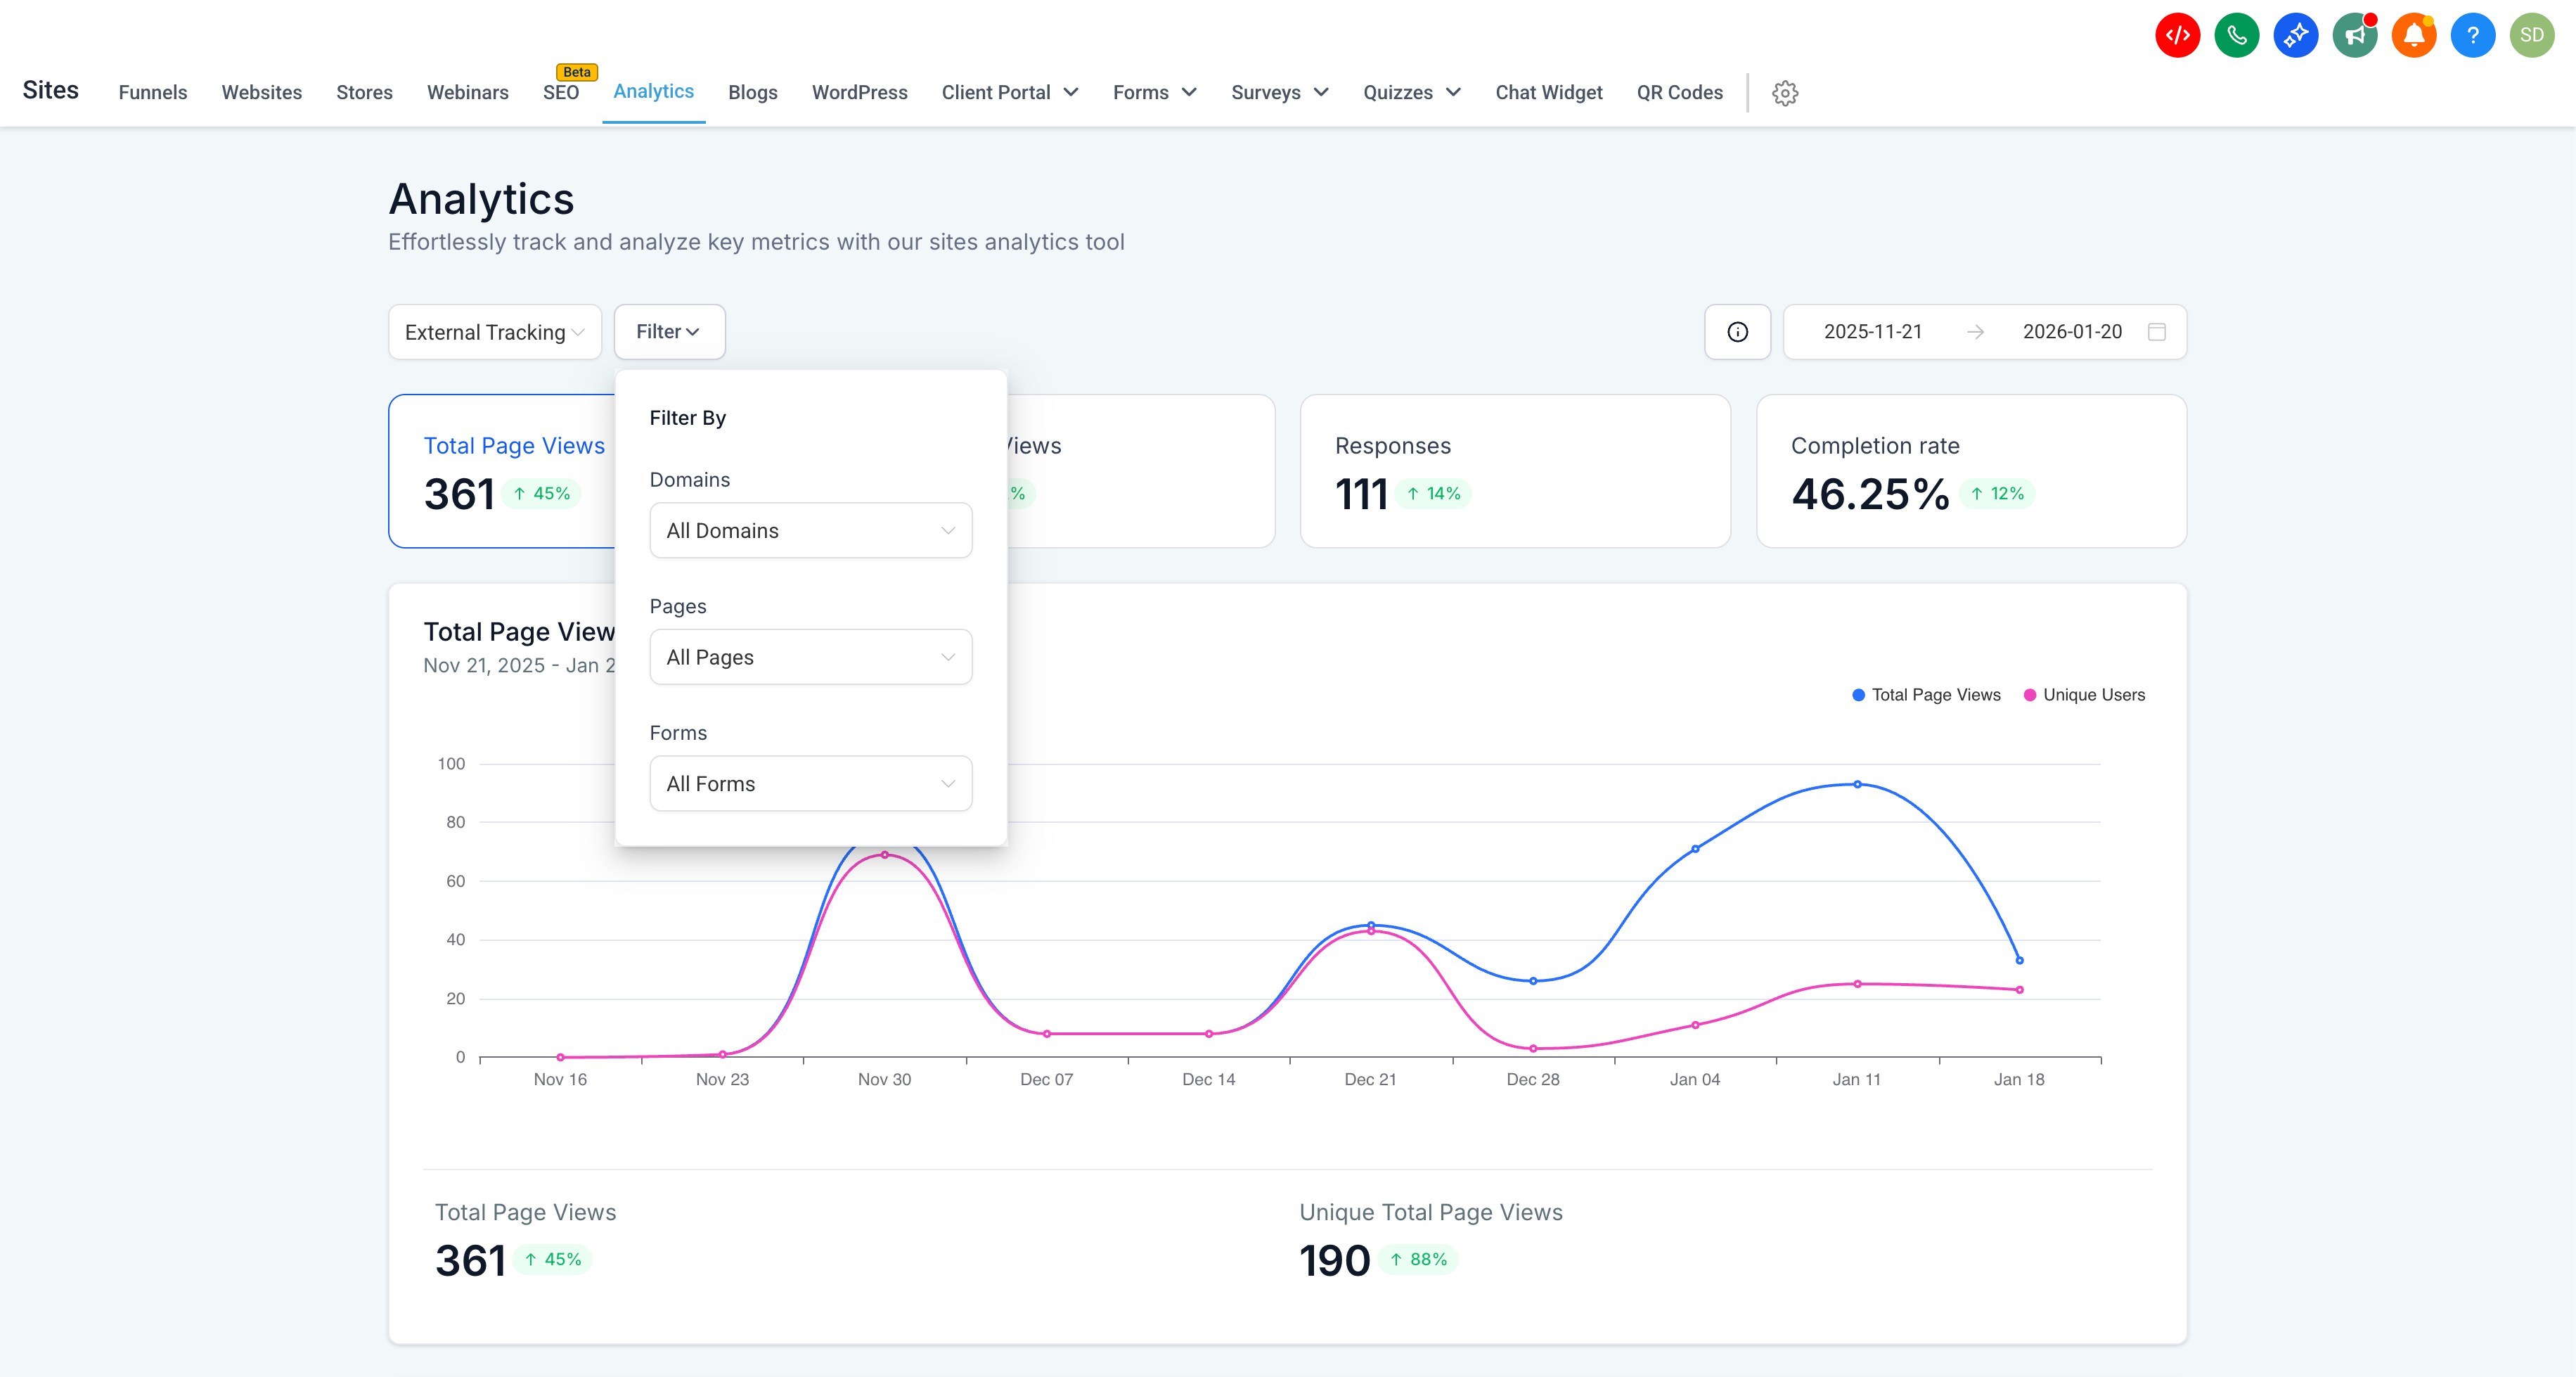
🔍 Filtering
Analytics can be refined using filters for:
Domains
Pages
Forms
This allows users to isolate performance without unnecessary noise.
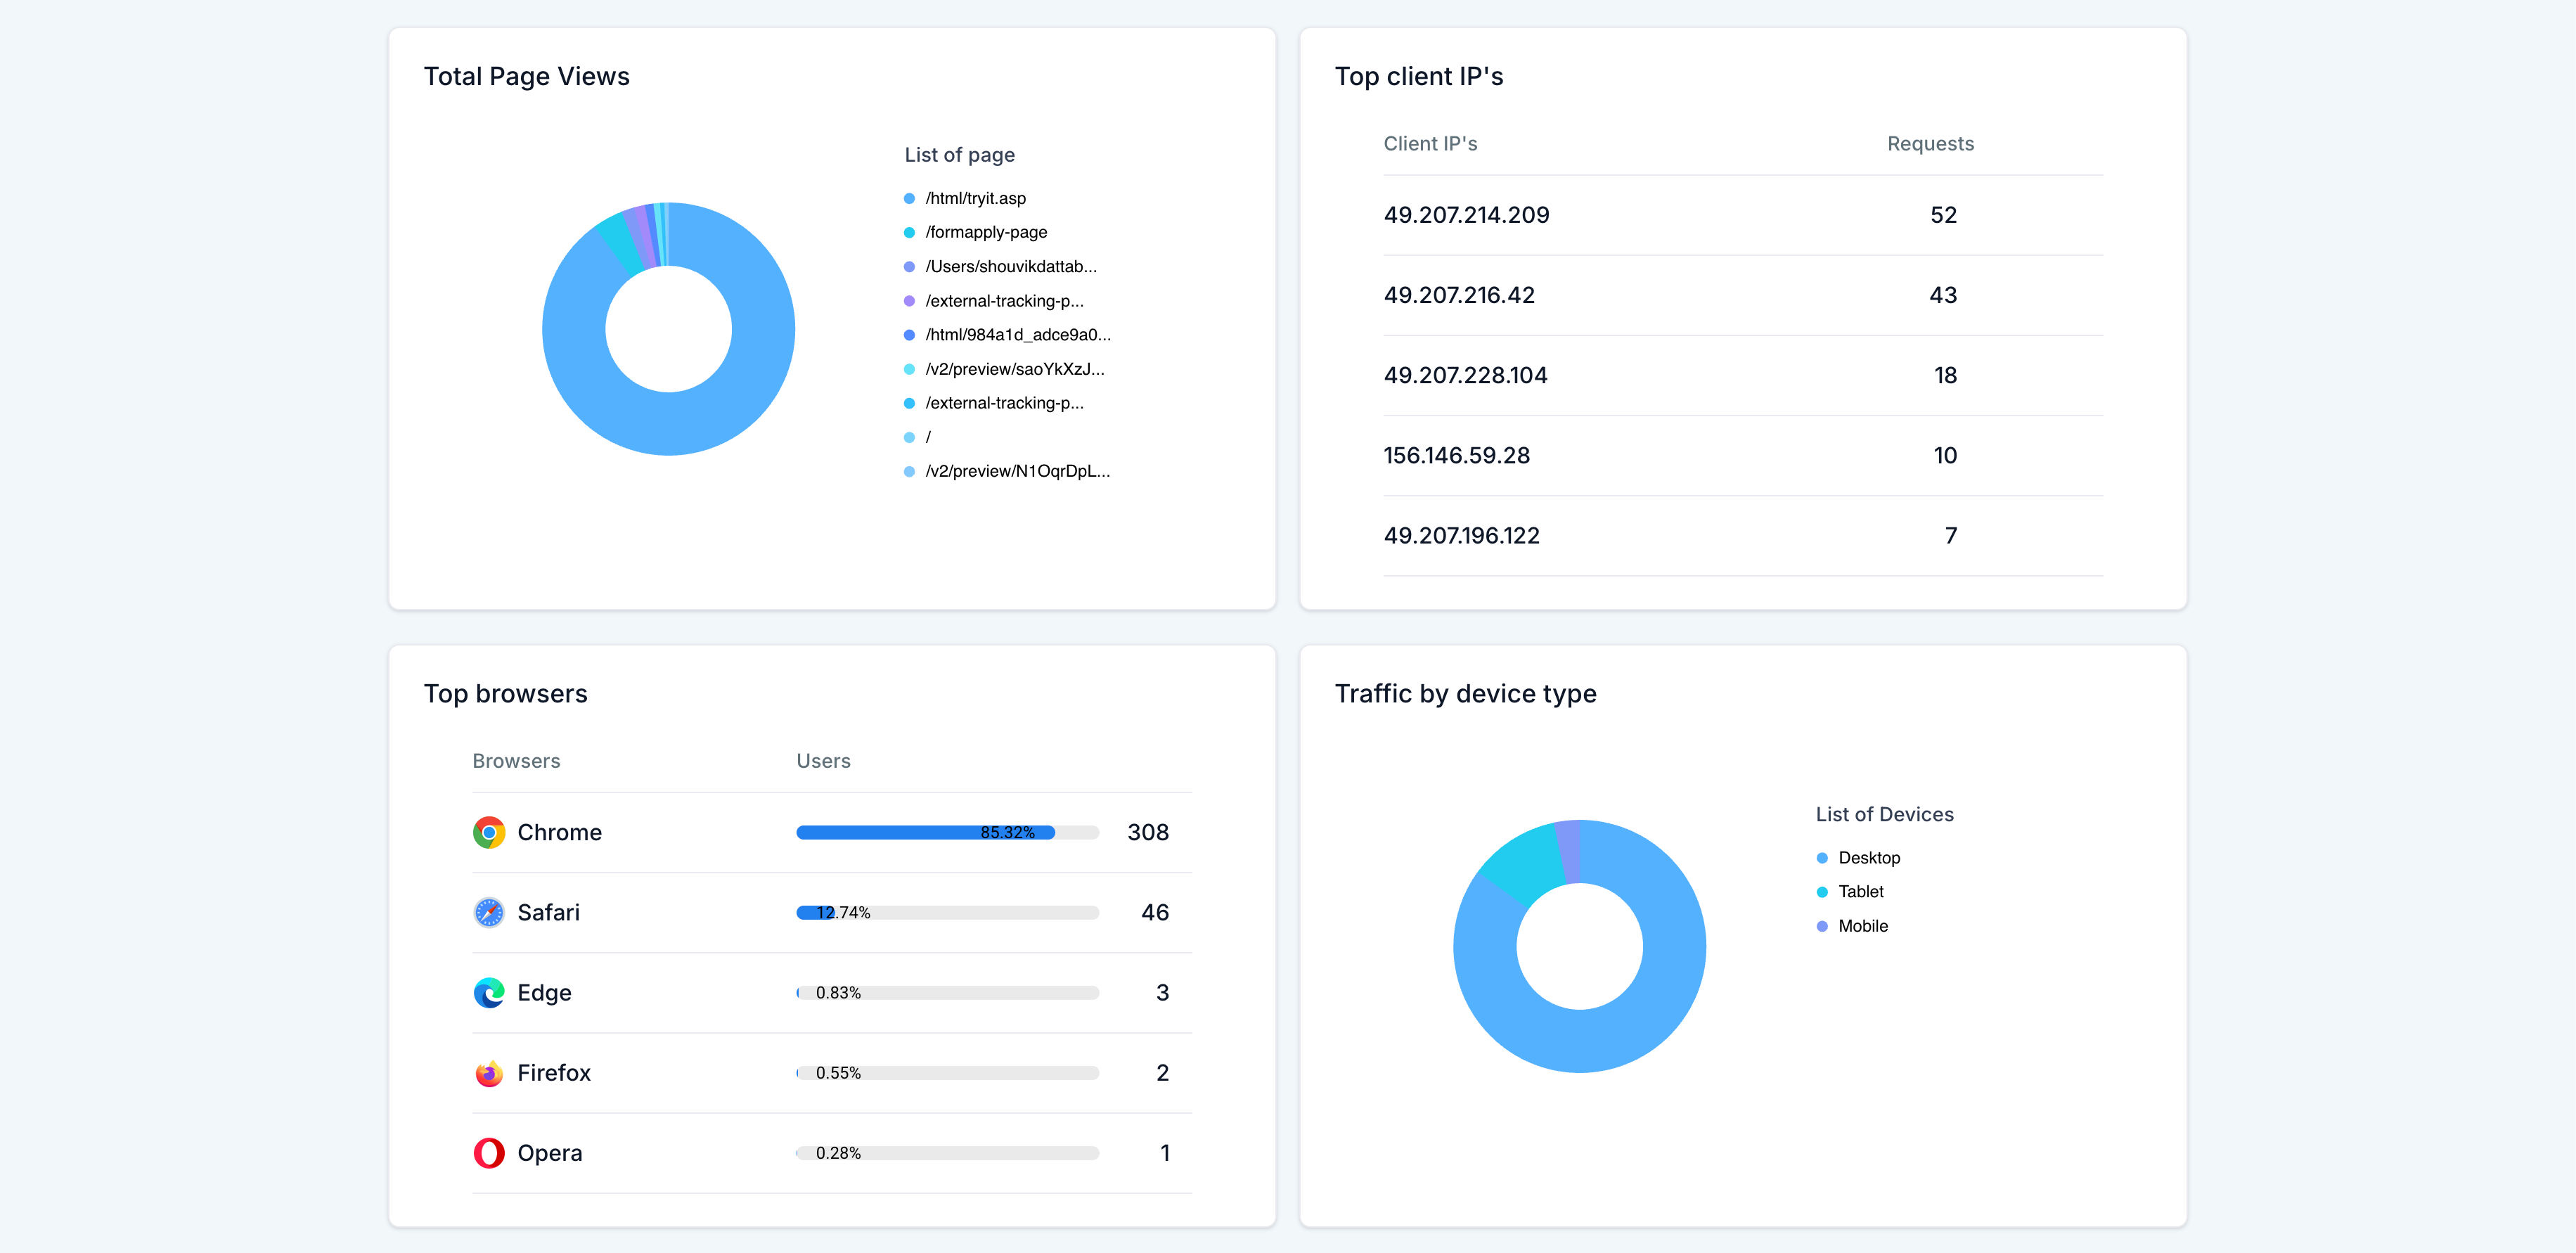
👥 Audience & Traffic Breakdown
Aggregated, anonymized insights include:
Traffic by Device Type
Top Browsers
Top Client IPs (aggregated)
Geographic distribution by: Country, State, City
🧾 Form-Level Analytics
A new All Forms section provides:
Form-wise breakdown of: Total Views, Responses, Completion Rate
Last updated timestamps for quick auditing
💡 Why This Matters
No third-party dependency:
Native analytics without external tools
Better optimization:
Understand what pages, forms, devices, and regions drive engagement
Consistent experience:
Analytics lives alongside Sites and Forms, reducing context switching
ℹ️ Important Note
The Average Time on Page metric started capturing data on January 20, 2026
Data prior to this date is not available